Loss Ratio, Expense Ratio, Combined Ratio: Which Matters
How the P&C combined ratio splits into a loss half and an expense half, why the split says more than the total, and the earned-versus-written mismatch.
Educational analysis for professional use. This guide is not investment advice or a recommendation to buy or sell any security, and it is not personalised.
A Sum Hides Its Parts
The combined ratio is one number built from two, and the two describe different businesses. Loss ratio is what the insurer pays out. Expense ratio is what it costs to write the policy in the first place. Add them and you get a scoreboard; look only at the scoreboard and you lose the information that tells you whether a weak result is fixable.
Two insurers can both print 92% and be opposite companies. One runs a cheap direct distribution model and prices too thin. The other pays broker commissions on every policy but underwrites well. The first has a pricing problem, and pricing problems close in a hard market. The second has a cost structure, and cost structures take years and a change of channel to move. Same total, different repair job, different multiple.
This guide is about telling the three numbers apart. For the definition of the combined ratio itself, the sub-100% and sub-95% screens, and where the verified comps sit, use the combined ratio scoreboard.
What Each Half Actually Measures
| Ratio | Numerator | What it scores | How fast it moves |
|---|---|---|---|
| Loss ratio | Incurred losses + loss adjustment expenses | Pricing adequacy, claims severity, catastrophe load, prior-year reserve development | Several points in a year |
| Expense ratio | Underwriting expenses: commissions, premium taxes, general and administrative | Distribution channel, scale, fixed-cost absorption | Slowly, and only by structural choice |
| Combined ratio | Both | Total underwriting result | Whatever the halves do |
Loss adjustment expense belongs on the loss side, not the expense side, even though the word “expense” is in it. It is the cost of investigating, defending and settling claims, so it scales with claims activity rather than with policy count. Firms with heavy litigation exposure carry a visibly larger LAE component.
The expense half is mostly acquisition cost. Commission to the agent or broker, premium taxes, and the underwriting and administrative overhead behind them. That is why the expense ratio is really a statement about a distribution model. A direct writer that spends on advertising instead of commission books the spend differently but still books it; a broker-fed commercial specialist pays a percentage of every dollar it writes and always will.
The Denominator Trap
Here is the mismatch that quietly breaks cross-company work. The loss ratio is conventionally struck on earned premium: losses incurred during the period are matched to the premium recognised during the period. The expense ratio is sometimes struck on written premium instead, because acquisition costs are incurred when the policy is sold rather than as it is earned. US statutory presentations lean this way; GAAP presentations generally put both halves on earned.
A combined ratio built from an earned loss ratio plus a written expense ratio is a trade-basis figure. It is a legitimate number, it is just not the same number as the all-earned version, and stacking one against the other is a comparison of definitions rather than of underwriting.
The direction of the distortion follows the growth rate:
- Premium growing: written premium runs ahead of earned premium in the same period, so the same expense dollars divide by a bigger denominator and the expense ratio prints lower.
- Premium flat: the two bases converge and the mismatch largely disappears.
- Premium shrinking: written falls below earned and the written-basis expense ratio prints higher, making a retrenching insurer look structurally more expensive than it is.
So an expense ratio that improves while the book grows fast has told you almost nothing until you know the denominator. Check the basis note in the financial supplement before you read the trend. This is the same discipline as checking whether a peer’s book value is stated before or after AOCI when you run P/BV against ROE: the label matters more than the level.
Same Total, Different Company
Take the illustrative diversified P&C insurer used across these guides: $20,000m of net earned premiums at a 92.0% combined ratio, split 65.0% loss and 27.0% expense. Set it beside a second illustrative writer with the identical total but the halves reversed in emphasis.
| Insurer A | Insurer B | |
|---|---|---|
| Loss ratio | 65.0% | 76.0% |
| Expense ratio | 27.0% | 16.0% |
| Combined ratio | 92.0% | 92.0% |
| Underwriting profit on $20,000m NEP | $1,600m | $1,600m |
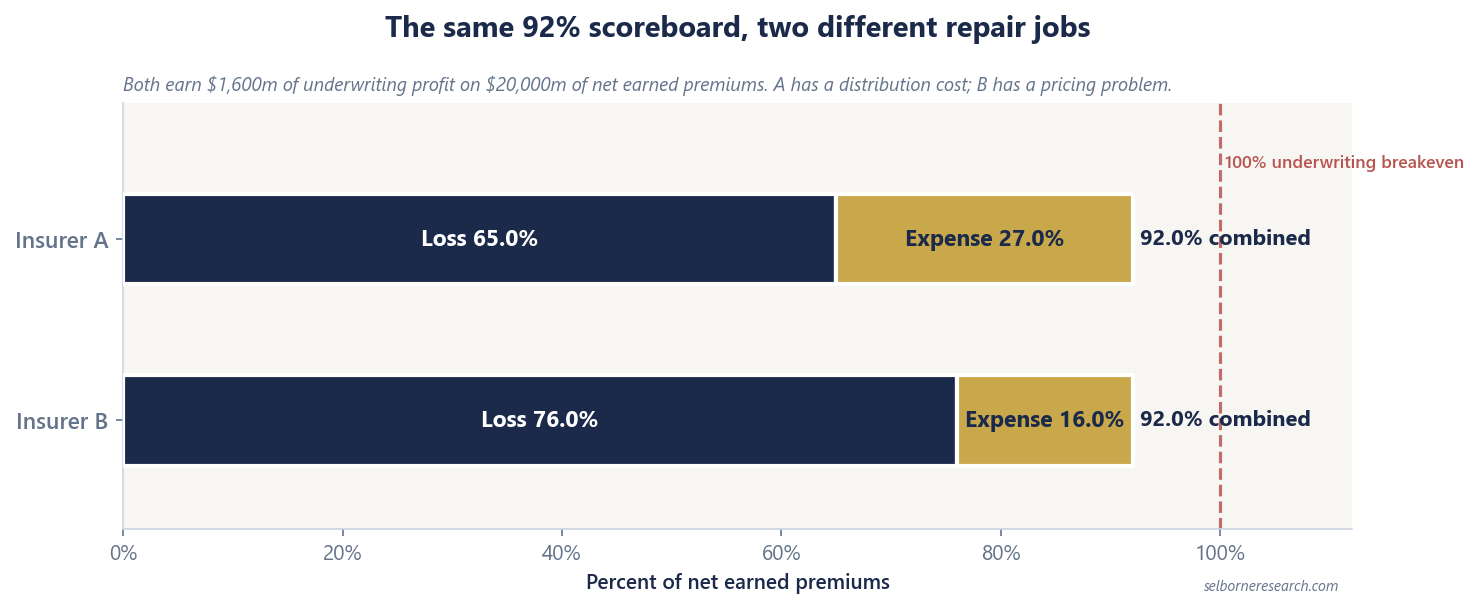
Identical underwriting profit. Not identical businesses.
Insurer A converts 65 cents of every earned dollar into claims, which is respectable underwriting, and spends 27 cents acquiring the business. Its problem is the cost of distribution. Fixing it means renegotiating commissions, cutting overhead or shifting channel, and none of those happen inside a year.
Insurer B acquires business for 16 cents, which is direct-model economics, and then pays out 76 cents. Its problem is price. If the market hardens and it puts through a mid-single-digit rate increase that sticks, several points come off the loss ratio without touching the cost base at all. The same insurer in a soft market has no such lever and the ratio drifts the other way.
Ask which half is doing the damage and you have asked what has to change. Ask only for the combined ratio and you have a grade with no diagnosis.
What Sits Inside the Loss Half Only
Three things distort the loss ratio and leave the expense ratio untouched, which means they distort the combined ratio without saying anything about the cost base.
Catastrophes are the obvious one. Cat losses added an estimated 7.6 points to the 2025 US industry combined ratio, against 8.8 points in 2024. All of that lands on the loss side. A year-on-year improvement in the combined ratio driven by a quiet wind season is not an improvement in the business.
Prior-year reserve development is the subtler one. Releasing redundant reserves from earlier accident years lowers the calendar-year loss ratio today on the strength of business written years ago. AIG’s FY2025 favourable development of $548m took 2.1 points off its General Insurance combined ratio. Strip development out and you get closer to the accident-year picture, which is the one that tests current pricing. The reserve development guide works through the sign convention and why a long favourable run does not prove present adequacy.
Reinsurance is the third. Ceding premium changes both the numerator and the denominator of the loss ratio, and it also shifts ceding commissions into the expense half. A gross-basis ratio and a net-basis ratio for the same insurer are different numbers.
Where the Comps Sit, and What They Do Not Show
The verified FY2025 comp ladder is a set of totals:
| Company | FY2025 combined ratio |
|---|---|
| Chubb (CB) | 85.7% |
| Progressive (PGR) | 87.4% |
| Travelers (TRV) | 89.9% |
| AIG General Insurance | 90.1% |
| US industry, AM Best preliminary | 92.2% |
| US industry, Verisk and APCIA preliminary | 92.9% |
We do not publish a companywide loss-and-expense split for these names, because a split is only meaningful once you have pinned the basis, and the bases differ between the four. Pull each half from the company’s own financial supplement, note whether the expense ratio is struck on written or earned premium, note whether the figures are gross or net of reinsurance, and only then put them in the same table.
That sounds fussy. It is the difference between finding that one insurer’s underwriting is genuinely nine points better than another’s and finding that its accountants use a different denominator.
Reading the Three Together
Rank on the combined ratio, diagnose on the split, and treat the expense ratio as the more informative of the two halves about what kind of company you are holding. Loss ratios across a peer group converge over a full cycle, because everyone eventually pays the same claims for the same risks. Expense ratios do not converge, because they are the residue of a distribution decision made years ago.
When a name’s combined ratio deteriorates, the first question is which half moved. If it is the loss half, find out whether it was cat, development, or the underlying accident-year loss ratio, because only the third one is a real signal about pricing. If it is the expense half on a written basis, check the growth rate before you conclude anything at all.
The split tells you which half is fixable, and stops there. The primer carries both halves into a justified price-to-book.
The Excel model is the primer's three residual-income valuations live across 13 sheets: change the combined ratio, the spread or the cost of equity and the justified P/BV moves.
Frequently Asked Questions
- What is the difference between the loss ratio and the expense ratio?
- The loss ratio is incurred losses and loss adjustment expenses divided by premiums: it scores whether the insurer priced the risk correctly and settled claims efficiently. The expense ratio is underwriting expenses, mainly commissions, premium taxes and administration, divided by premiums: it scores the cost of acquiring and servicing the business. Adding the two gives the combined ratio.
- Is the combined ratio just the loss ratio plus the expense ratio?
- Arithmetically yes, but only if both halves use the same premium denominator. The loss ratio is conventionally struck on earned premium. The expense ratio is sometimes struck on written premium, particularly on US statutory presentations. A combined ratio that mixes the two bases is a trade-basis figure and is not directly comparable with an all-earned one.
- Why does the split matter if two insurers have the same combined ratio?
- Because the halves have different causes and different fixability. A high expense ratio reflects distribution: commissions, broker economics and fixed costs spread over the premium base, and it changes slowly through structural decisions. A high loss ratio reflects pricing adequacy, claims severity, catastrophe load and reserve development, and it can move several points in one year with the rate cycle. Same total, different business.
- Does a growing insurer show a flattering expense ratio?
- It can, if the expense ratio is struck on written premium. When premium volume is rising, written premium exceeds earned premium in the same period, so the same expense dollars divide by a larger number and the ratio prints lower. The effect reverses when growth stalls. Confirm the denominator before reading an expense-ratio improvement as genuine cost discipline.