Distribution Coverage Ratio: the MLP Safety Metric
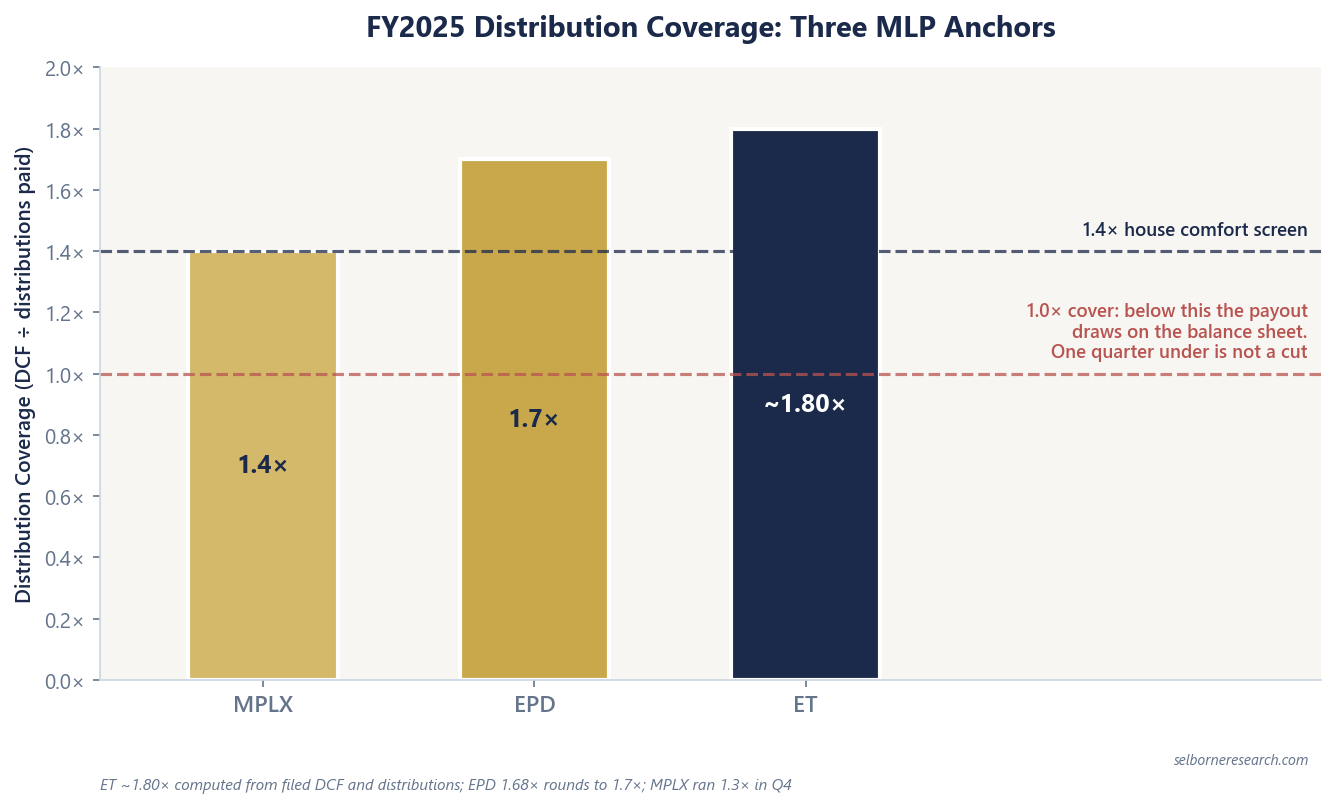
Coverage is DCF ÷ distributions paid: EPD 1.7×, ET ~1.80× computed, MPLX 1.4× at the comfort floor, and why the partnership part-writes its own numerator.
Educational analysis for professional use. This guide is not investment advice or a recommendation to buy or sell any security, and it is not personalised.
What Coverage Measures, and Who Decides It
Distribution coverage is the number an MLP grades its own payout with, and the partnership has a hand in writing it. The ratio is distributable cash flow divided by distributions paid. Above 1.0×, the partnership generated more cash than it mailed to unitholders; below 1.0×, the payout ran ahead of internal cash generation.
The denominator is not in dispute: distributions paid is cash out of the door. The numerator is a judgement. Distributable cash flow has no accounting definition, so each partnership writes its own and publishes the reconciliation. Enterprise Products’ 8-K language (28 April 2008) compares distributable cash flow generated to cash distributions expected; Energy Transfer divides DCF by distributions related to common unitholders. Same ratio, two house definitions, and one lever inside the numerator that moves the answer more than anything else on the page. That lever is the split between maintenance and growth capital, dealt with below.
This is not dividend cover at a C-corporation. Kinder Morgan and Williams file as C-corps; KMI no longer discloses DCF as a primary metric from FY2025. Coverage belongs in the MLP workflow after you have confirmed the DCF label, not in a blended screen of every midstream name.
FY2025 Coverage Ladder
| MLP | DCF ($M) | Distributions paid ($M) | Coverage | Leverage | Cap (Jun 2026) |
|---|---|---|---|---|---|
| ET | 8,202 (partner-level) | 4,555 | ~1.80× (computed) | Lower half of 4.0–4.5× target | ~$65.6B |
| EPD | 8,000 | 4,752 | 1.7× (1.68× computed) | 3.3× (target 3.0× ± 0.25×) | ~$80.8B |
| MPLX | 5,791 | ~4,136 (implied) | 1.4× (Q4 1.3×) | 3.7× (supported ~4.0×) | ~$57.6B |
ET’s coverage is computed from filed partner-level DCF and distributions; the Q4 release does not headline the ratio. MPLX’s implied distributions come from DCF ÷ 1.4×. EPD also cites operational DCF of $7,904M at 1.7× against distributions declared; the table uses the primary $8,000M filing line.
Worked Example: ET Coverage Arithmetic
Energy Transfer FY2025 partner-level figures:
| Line | $M |
|---|---|
| Adjusted DCF attributable to partners | 8,202 |
| Distributions to partners | 4,555 |
| Coverage | 8,202 ÷ 4,555 = 1.80× |
| Residual after distributions | 8,202 − 4,555 = 3,647 |
It is that last line that makes the point, not the ratio above it. ET guides $5.6–$5.9B of growth capex for 2026, so the residual falls roughly $2.0–2.3B short of the building programme. Run the same sum at Enterprise Products, whose coverage is the lower of the two at 1.7×, and $3,248M of residual roughly matches a $2.9–$3.4B growth guide. The partnership with the better-looking ratio is the one going to the market for money. Coverage tells you the distribution is not drawing down the balance sheet; it says nothing about whether everything else the partnership is doing is.
MPLX is a third shape again. On $5,791M of DCF at 1.4× coverage, implied distributions are ~$4,136M, an implied yield of ~7.2% on a ~$57.6B cap. Marathon Petroleum owns 63.7% of the common units, so the sponsor is both the partnership’s main customer and the largest recipient of the distribution it funds. The ratio sees none of that.
Where the Ratio Bends
Maintenance capital keeps the existing system running at its current capacity. Growth capital builds something that was not there before. Maintenance is deducted on the way to distributable cash flow; growth is not. No accounting standard draws the line between them, so the partnership draws it, and no auditor tests where it fell.
Take $200M spent on a compressor station. Booked as maintenance, it comes out of the numerator and coverage falls. Booked as growth, it sits outside the bridge, DCF is $200M higher and the payout looks better funded. The money left the building either way. Against MPLX’s ~$4,136M of distributions that one call is worth about 0.05× of coverage; at a partnership distributing $800M it is worth a quarter of a turn. This is the single reason to treat coverage as a starting point rather than an answer, and the same judgement runs through every DCF figure a midstream company files.
The check that cannot be reclassified is free cash flow after every dollar of capital spending, and then after distributions. If that number is negative, the payout was funded by borrowing or by issuing units, whatever the ratio said. A partnership can print 1.2× coverage every quarter for years while doing exactly that. So read coverage next to the financing section of the cash flow statement, where debt drawn and units sold are recorded, rather than on its own.
One distortion sits on the denominator too. Where unitholders take new units instead of cash under a distribution reinvestment plan, the distribution is declared and reported as paid, but the cash never leaves. Coverage is unaffected. The unit count is not: next year the same assets owe a distribution on a larger base. A ratio holding steady while units outstanding climb is a slower version of the same problem.
Comfort Bands
| Coverage zone | Interpretation | Comp-set anchor |
|---|---|---|
| >1.4× | Room to raise the distribution, or a payout set below what the assets earn | EPD 1.7×, ET ~1.80× |
| 1.0–1.4× | Covered, with little spare for growth capital | MPLX 1.4×; Q4 1.3× dipped lower |
| <1.0× | The payout is drawing on the balance sheet | Ask how long for, and what is funding it |
The 1.4× screen is an illustrative convention, not a covenant, and it is not a scale where higher always scores better. A partnership well above the band is sometimes building room deliberately and sometimes paying out less than it led unitholders to expect. Occasionally a strong ratio is a scar: cut the distribution hard enough and coverage recovers by arithmetic, on a payout the market had already stopped believing in.
The low end needs the same care. A quarter below 1.0× is not a cut. Partnerships run under 1.0× through a turnaround, an outage or a contract gap and fund the difference from the revolver, then recover. What decides it is persistence and funding source: one quarter on a revolver is a working-capital event, four quarters funded by issuing units is a distribution being paid by new investors.
Coverage and leverage interact, so read them together. MPLX filed 3.7× total debt to LTM adjusted EBITDA against management’s supported ~4.0×. A 1.4× ratio with rising growth capex and 3.7× leverage leaves less headroom than 1.7× at 3.3× with a building programme the residual roughly funds.
What Coverage Does Not Capture
Coverage is a one-year answer to a one-year question: cash in against payout out. What it cannot tell you is whether next year’s cash survives a volume shock, and that lives in the contract mix. Take-or-pay and fee-based shares are the guide to it, though the percentages are not comparable between filers because each quotes them on a different denominator.
It also cannot see how hard the assets are being worked. Maintenance spending is the pressure valve: hold it down and coverage improves this year while the system quietly ages. Enterprise Products’ sustaining capital guide of roughly $580M runs near 6% of its adjusted EBITDA, which is a useful order of magnitude to carry into other filers. A partnership whose coverage rose in a year when that share fell has bought the ratio rather than earned it.
Then there is the level you divide at. Energy Transfer’s consolidated DCF is $10,615M, but coverage belongs on the $8,202M partner line, because the difference is cash attributable to interests that never receive the common distribution. Use the wrong numerator and you overstate safety by about 30%. At C-corps, the label changes again: Williams reports AFFO of $5,858M; Enbridge DCF of C$12,454M (C$5.71/share). Neither publishes MLP-style coverage in the same table, so compare dividends to AFFO or DCF per share instead.
Linking Coverage to Valuation
Yield is where coverage meets price, and the two line up less neatly than the screen suggests. Computed FY2025 yields: EPD ~5.9% on 1.7× coverage, ET ~6.9% on ~1.80×, MPLX ~7.2% on 1.4×, all inside the ~5–8% large-cap MLP band. Energy Transfer has the strongest coverage of the three and still yields a point more than Enterprise Products, because the market is also pricing leverage, the size of the building programme and what each partnership has done to its payout before. Coverage tells you whether a yield is being paid out of cash. It does not tell you what the yield ought to be.
EV/EBITDA screens use adjusted EBITDA, not DCF. A name can trade at 9× EBITDA with modest coverage if the market prices growth projects (ET’s scale) or sponsor support (MPLX). Run coverage before treating yield as cheap.
The order of work: pull DCF and distributions paid from the same exhibit, compute the ratio yourself, then read four quarters rather than the annual print, because MPLX’s 1.3× Q4 against a 1.4× year is the kind of drift an annual figure hides. Read the maintenance capital line that produced the numerator. Then check the cash flow statement for what the financing section did over the same period. If the company files no DCF at all, as Kinder Morgan has since 2025, use free cash flow and dividend cover instead. Forcing a coverage ratio onto a filer that stopped publishing one is how a screen labelled safe fills up with payouts nobody is funding from cash.
A covered distribution still leaves growth capex to be funded. The primer carries coverage into a ten-year cash-flow valuation.
The Excel model is the primer's two DCF archetypes live across 11 sheets: change the growth rate, uFCF conversion or discount rate and the valuation moves.
Frequently Asked Questions
- How do you calculate distribution coverage ratio?
- Distribution coverage ratio is distributable cash flow divided by distributions paid (or declared, matching the filer's definition). Enterprise Products Partners generated $8,000M DCF and paid $4,752M in distributions in FY2025, for computed coverage of 1.68× (company rounds to 1.7×). Energy Transfer's partner-level adjusted DCF of $8,202M divided by $4,555M distributions to partners yields ~1.80×. Use the DCF line management pairs with distributions in the earnings exhibit, and remember that the partnership defines that line itself: distributable cash flow has no accounting standard behind it.
- What is a good distribution coverage ratio for an MLP?
- Above 1.4× is the usual comfort screen for large MLPs. Enterprise Products at 1.7× and Energy Transfer at ~1.80× sit above it; MPLX at 1.4× sits on it, and ran 1.3× in Q4. Between 1.0× and 1.4× the payout is covered but there is little spare for growth capital. Below 1.0× the distribution is drawing on the balance sheet, which is not the same as a cut: a partnership can run under 1.0× for a quarter or two through a turnaround and fund the gap from its revolver. What matters is whether it persists and what is filling the hole. Higher is not automatically better either, since a high ratio can be the scar left by a distribution that was already cut.
- Why doesn't Kinder Morgan report distribution coverage?
- Kinder Morgan is a C-corporation that ceased primary DCF disclosure from FY2025, reporting free cash flow of $2,891M instead. Coverage is an MLP distribution-policy metric tied to K-1 payouts. C-corp midstream names such as Williams and Enbridge emphasise dividends and AFFO or DCF per share rather than a coverage ratio. Do not force a coverage calculation on KMI without a filed DCF numerator.