EV/EBITDA by Midstream Asset Type
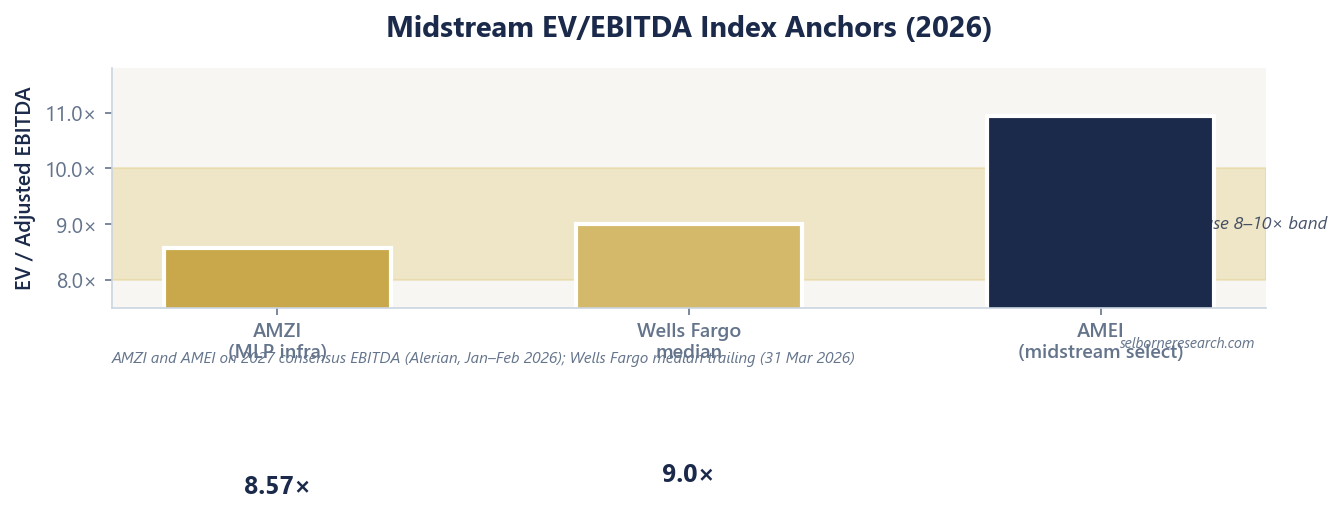
Pure-MLP indices screen below C-corp-heavy midstream: AMZI 8.57× vs AMEI 10.94×, Wells Fargo median 9.0×, and the illustrative 8–10× large-cap band.
Educational analysis for professional use. This guide is not investment advice or a recommendation to buy or sell any security, and it is not personalised.
Midstream Screens on EBITDA, Not NAV
Midstream equity is valued on enterprise value divided by adjusted EBITDA, not on reserve NAV or per-barrel netback.
Pipelines, gathering systems, fractionators and storage earn fee-based tolls. Adjusted EBITDA is the standard operating denominator for leverage ratios and relative valuation. Definitions differ by filer (segment EBDA at Kinder Morgan, consolidated adjusted EBITDA at Enterprise Products Partners and Energy Transfer, CAD at Enbridge), but the screen is the same: EV ÷ LTM or forward adjusted EBITDA.
E&P producers answer a different question. Their cash flows decline with production and move with commodity prices. EV/DACF and NAV are the right tools there. Applying E&P multiple logic to a heavily contracted gas transmission network misstates the risk sitting in the denominator.
Index Anchors (Feb–Mar 2026)
Published benchmarks set the band. Do not invent a “sector average” multiple; use the indices.
| Benchmark | EV/EBITDA | Basis | As-of |
|---|---|---|---|
| AMZI (Alerian MLP Infrastructure) | 8.57× | Forward, 2027 consensus EBITDA | 31 Jan 2026 |
| AMEI (Alerian Midstream Energy Select) | 10.94× | Forward, 2027 consensus EBITDA | 28 Feb 2026 |
| Wells Fargo midstream universe | 9.0× median | Trailing EBITDA; 10-yr average 9.3× | 31 Mar 2026 |
| Illustrative large-cap band (convention) | ~8–10× | LTM adjusted EBITDA | Feb–Mar 2026 |
Pure-MLP indices screen lower than C-corp-heavy ones, and some of that is the wrapper, as MLP vs C-corp sets out. K-1 reporting shortens the list of buyers, and a partnership paying most of its cash out has less left to fund itself with.
Resist reading the whole 2.4 turns that way. The two indices do not hold the same companies: AMEI reaches into Canadian corporates and a different asset mix, so part of the spread is what each index owns rather than how it is taxed. Two index prints cannot separate the two effects. Take the gap as the outer bound of what structure is worth.
What Moves You Inside the Band
A multiple is a price for a stream of EBITDA, so what moves it is how long that stream runs and how sure it is. Twenty years of contracted capacity on a regulated gas system is worth more per dollar of EBITDA than gathering volumes that reprice in three, and the market pays accordingly.
Which makes this screen the opposite of a bargain finder. A partnership carrying heavy leverage, a sponsor it cannot say no to, or a contract book about to reprice should trade below the band, and usually does. The low multiple is the market’s answer, not its mistake. The work is deciding whether the discount is bigger than the problem causing it, and that means going after the problem rather than the number reporting it.
| Asset / driver | Multiple tendency | FY2025 example |
|---|---|---|
| Regulated gas transmission | Upper band; demand-pull from LNG/power | WMB $7,750M EBITDA; >90% fee-based; ~7.1 Bcf/d expansions in execution |
| Diversified NGL / liquids infrastructure | Mid-band; growth capex intensity | EPD $9,964M EBITDA; 82% of gross operating margin fee-based; ~$4.8B backlog |
| Large-scale MLP gatherer / processor | Lower band unless coverage is strong | ET $15,984M EBITDA; ~90% fee-based; leverage lower half of 4.0–4.5× target |
| Cross-border liquids mainline + utility gas | Upper band; CAD reporting | ENB C$19,952M EBITDA; 98% low-risk; Mainline 3.1 MMbpd |
| Refiner-sponsored gathering | Mid-to-lower; sponsor risk | MPLX $7,017M EBITDA; MPC owns 63.7%; coverage on the 1.4× floor |
Take-or-pay and fee-based percentages will not line up across these filers, because each quotes its share on a different base: Enterprise Products on gross operating margin, which is revenue less the direct cost of running the assets; Energy Transfer on adjusted EBITDA; Kinder Morgan on a budgeted segment earnings figure. Use them to explain where a name sits inside the band, never as a league table.
Worked Example: EV at the 9.0× Median
Wells Fargo’s 9.0× trailing median is the neutral anchor. Apply it to Enterprise Products Partners’ FY2025 adjusted EBITDA:
| Input | Value |
|---|---|
| Adjusted EBITDA | $9,964M |
| EV/EBITDA anchor | 9.0× |
| Implied enterprise value | $89,676M |
Now set that against what the market is actually paying. Enterprise value is what the whole business costs, equity plus the debt that comes with it. EPD’s units were worth ~$80.8B on 9 June 2026 and its net debt runs at 3.3× adjusted EBITDA, roughly $33B on that ratio, so the enterprise is priced nearer $114B and the multiple nearer 11× than 9×. The median is where the sector clusters, not where any one name has to sit, and a gap that size is the thing to explain rather than an error to correct. Note too that the multiple and the leverage ratio share a denominator: change how EBITDA is defined and both screens move together.
Debt is not the only thing standing between the unitholder and enterprise value. Preferred units, hybrid securities and the stakes outsiders hold in consolidated subsidiaries all sit inside EV, and each has a claim on the EBITDA ahead of the common units. Energy Transfer is the clearest case. It consolidates $15,984M of adjusted EBITDA, but of the $10,615M of distributable cash flow that produced, only $8,202M reaches the partners; a little under a quarter belongs to non-controlling and subsidiary interests that never see the common distribution. Screen ET at 9× on the consolidated figure and you have priced a pool of cash the common unitholder does not fully own. So check what the enterprise value is buying before dividing by it.
At AMZI’s 8.57×, the same $9,964M EBITDA implies EV of $85,391M. At AMEI’s 10.94×, EV rises to $109,006M. A $23.6B swing on one unchanged EBITDA figure is the argument for anchoring to the index that matches your universe rather than to whichever number is nearest.
MLP Payout Yields vs Multiples
Yield and multiple are two views of the same price, so they generally move against each other. Neither of them tells you the price is right. Computed FY2025 payout yields, from filed distributions and June 2026 caps:
| MLP | Implied yield | Coverage | Cap |
|---|---|---|---|
| EPD | ~5.9% | 1.7× | ~$80.8B |
| ET | ~6.9% | ~1.80× | ~$65.6B |
| MPLX | ~7.2% | 1.4× | ~$57.6B |
Those three yields span 1.3 percentage points, and the order they fall in is not an order of value. MPLX pays the most and sits on the 1.4× comfort floor: covered, with less left over once the distribution is paid, and with Marathon Petroleum, its sponsor and main customer, on the receiving end of 63.7% of it. EPD pays the least, holds 1.7× coverage, and its residual cash roughly funds its own growth programme. ET sits between the two on yield and guides $5.6–$5.9B of growth capex for 2026, well over what it retains. Read a yield with coverage beside it. A high one is often the market pricing a payout it does not expect to grow.
Using the Screen in Practice
Start with the index that matches your universe (AMZI for MLPs, AMEI for blended midstream). Mark the illustrative 8–10× band. Then adjust individual names for leverage (EPD 3.3× vs ENB 4.8× debt-to-EBITDA), contract denominators, and sponsor risk (MPLX/Marathon).
Do not compare midstream EV/EBITDA to E&P EV/DACF without relabelling the risk. Do not apply commodity price decks to tariff EBITDA: midstream models run on throughput and fee coverage; Henry Hub at $3.00/MMBtu in the planning deck sets LNG and power demand context, not pipeline tariff revenue.
When a name screens well below AMZI, work through the denominator before calling it cheap. Is the EBITDA normalised, with one-offs stripped the same way each year? Is it the whole consolidated figure when part of it belongs to somebody else? And is there a reason the market is paying less: contracts about to reprice, leverage above the peer group, a sponsor whose interests are not the unitholder’s? A multiple below the band with none of that attached is worth a second look. A multiple below the band with three of them is simply priced.
An index multiple gives you a band and stops there. The primer derives the multiple from its own ten-year cash-flow build.
The Excel model is the primer's two DCF archetypes live across 11 sheets: change the growth rate, uFCF conversion or discount rate and the valuation moves.
Frequently Asked Questions
- What is a normal EV/EBITDA multiple for midstream?
- Large-cap midstream works to a rough 8–10× band. The Alerian MLP Infrastructure Index (AMZI) screened at 8.57× on 2027 consensus EBITDA (31 January 2026) and the Alerian Midstream Energy Select Index (AMEI) at 10.94× (28 February 2026), both forward; Wells Fargo's midstream universe median was 9.0× on trailing EBITDA at 31 March 2026, against a 10-year average of 9.3×. The band is a working convention rather than a fair value. A partnership with a short contract book, heavy leverage or a sponsor it cannot refuse belongs below it, and a low multiple on any of those grounds is a price, not a bargain.
- Why do MLP midstream stocks trade at lower multiples than C-corps?
- Partly the wrapper, but less of it than the gap suggests. AMZI screened at 8.57× and the C-corp-heavier AMEI at 10.94×. Some of that spread is holder base: 1099 reporting brings in institutions that cannot process a K-1, and C-corps retain cash rather than paying most of it out. But the two indices do not hold the same companies. AMEI reaches into Canadian corporates and a different asset mix, so part of the difference is what each index owns rather than how it is taxed. Treat the 2.4 turns as an upper bound on what structure is worth, and compare like indices before ranking individual names.
- How does midstream EV/EBITDA compare to E&P multiples?
- Midstream toll roads earn fee-based EBITDA with limited direct commodity price exposure, so multiples cluster in the high single digits to low double digits. E&P producers trade on NAV and EV/DACF against reserve decline and price decks. A 9× midstream multiple on stable contracted EBITDA is not comparable to a 5× E&P multiple on price-sensitive cash flow; the denominators carry different risk.