LEO vs GEO Satellite Economics
Why orbit class, not company size, sets a satellite operator's capital cycle: a LEO replacement plateau against a GEO fleet's staggered per-satellite build.
Educational analysis for professional use. This guide is not investment advice or a recommendation to buy or sell any security, and it is not personalised.
Orbit Is an Economic Choice, Not Just a Technical One
Two satellite operators can be roughly the same size and still run completely different capital cycles, because the orbit they chose decides how many satellites they need and how those satellites get replaced. Iridium’s own FY2025 10-K lays out the altitude comparison plainly: geostationary (GEO) satellites sit “approximately 22,300 miles above the equator,” medium-earth-orbit (MEO) satellites orbit “between approximately 6,400 and 10,000 miles above the earth’s surface,” and low-earth-orbit (LEO) satellites “such as those in our constellation” fly “between approximately 300 and 1,000 miles above the earth’s surface.”
That altitude difference is not a footnote. A GEO satellite parked far out can hold a fixed position relative to the ground and cover a huge footprint from a single spacecraft. A LEO satellite flying a few hundred miles up covers far less ground and moves fast relative to the surface, so global LEO coverage needs a whole constellation working together rather than one satellite. That single fact, more than fleet size or revenue, is what makes a LEO capex cycle look like a rolling replacement programme and a GEO capex cycle look like a sequence of one-off builds.
The Worked Example: Iridium NEXT and the Post-Build Plateau
Iridium is the cleanest filed example of what a full LEO replacement cycle looks like end to end, because the company has already lived through one and told investors what comes next.
| Item | Value | Basis / as-of |
|---|---|---|
| Iridium NEXT programme cost | ~$3 billion | Iridium fact sheet, Dec 2024 |
| Satellites delivered | 66 operational, plus in-orbit spares | 10-K, FY2025 (31 Dec 2025) |
| Build period | 2010 to February 2019 | Iridium fact sheet, Dec 2024 |
| Satellite useful life | 17.5 years (extended from 12.5 years in Q4 2023) | 10-K, FY2025 |
| Constellation cycle | ”15-to-20-year constellation operational cycles”; lower capex expected “until at least 2031” | 10-K, FY2025 |
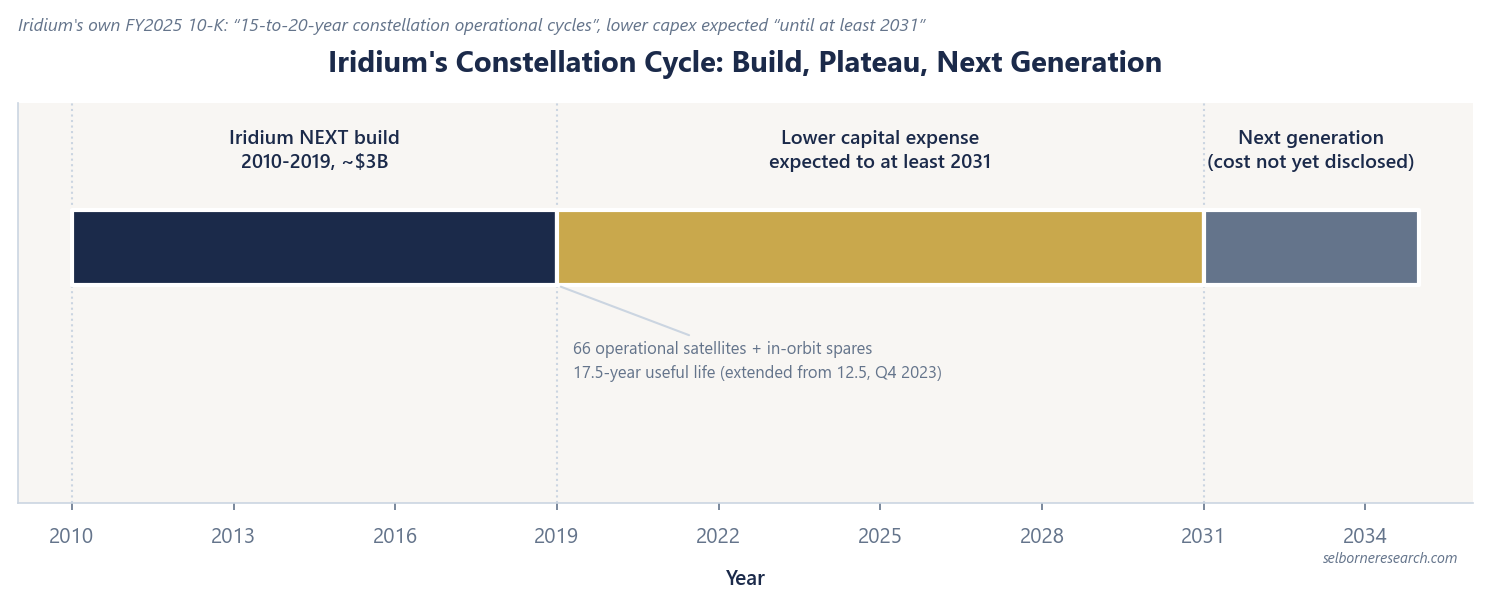
The 10-K’s own words matter here as much as the number: Iridium says it incurs “periodic higher capital costs in connection with designing, building and launching new generations of our satellites to support our 15-to-20-year constellation operational cycles,” and that it is “currently in a period of lower capital expense, which we expect to continue until at least 2031.” That is a company describing its own capex cycle as a plateau bounded by two build phases, not a steady annual run rate.
What a GEO Fleet’s Cycle Looks Like Instead
A GEO operator does not replace a constellation all at once; it develops a handful of large satellites on staggered individual schedules, so the fleet is always a mix of ages. Viasat’s FY2025 10-K describes 23 in-service or operational satellites already flying, spanning the Ka-, L- and S-bands, alongside eight further GEO satellites under development: two more high-capacity Ka-band satellites, three adaptive Ka-band satellites and three L-band safety-service satellites. Satellites already in service sit alongside units still being built, which is the opposite pattern to a LEO constellation that goes up and comes down together.
EchoStar states its own design-life range directly in its FY2025 10-K: “Generally, the minimum design life of each of our owned and leased satellites ranges from 12 to 15 years.” Where Iridium describes one multi-year build feeding a fleet-wide plateau, EchoStar and Viasat are describing individual satellites each carrying its own clock, so their capex shows up as separate lumps whenever any one satellite nears the end of its life or a new one is contracted, not as a single fleet-wide cycle.
Design Life Is a Programme Choice, Not an Orbit Rule
It is tempting to assume GEO satellites simply last longer than LEO ones, since GEO fleets are smaller and each unit costs more to replace. The filed numbers do not support that as a general rule.
| Filer | Orbit | Own stated figure |
|---|---|---|
| Iridium | LEO | ”estimated to be 17.5 years” (extended from 12.5 years in Q4 2023) |
| Viasat | GEO | ”Satellites (estimated useful life of 7 - 17 years)“ |
| EchoStar | GEO | ”the minimum design life of each of our owned and leased satellites ranges from 12 to 15 years” |
Iridium’s 17.5-year figure is the longest of the three, ahead of the top of Viasat’s own range and well ahead of EchoStar’s. Useful life is a manufacturer and mission decision, driven by things like radiation shielding and the fuel budget built into a given programme, not something that follows automatically from how far out the satellite orbits.
What a Replacement Programme Costs When It Is Disclosed
Per-satellite or per-constellation costs are rarely public until an operator actually signs a manufacturing contract. Globalstar’s two agreements with MDA Space are the disclosed example in this set of six, and the filing gives the contract price without breaking it down per satellite.
| Contract | Satellite count | Contract price | As-of |
|---|---|---|---|
| 2022 MDA Space agreement | At least 17 (up to 26 with FCC authorisation) | $329.3M for the 17, plus $5.0M for a satellite operations control centre | FY2025 10-K |
| February 2025 MDA Space agreement | More than 50 (third-generation C-3 System) | $775.0M total | FY2025 10-K |
Globalstar’s 10-K states these as total contract prices rather than a per-satellite cost, so this guide does not divide one by the other. Where a filing gives a figure, use the figure it gives.
Reading Orbit Class in a Model
The practical consequence for a model is that which years carry the build changes what a single capex-to-revenue ratio means. A year that falls inside a LEO constellation build, like Iridium’s 2010-2019 window, will show a capex ratio far above the operator’s steady state, because the whole fleet is being paid for at once. The capex intensity guide covers how to read that ratio against screening bands once you know which phase a filer is in. A GEO operator’s capex ratio moves less dramatically year to year because its satellites are staggered, but a single large GEO contract can still spike one year’s number without saying anything about the fleet as a whole.
Neither cycle tells you whether the operator can fund itself day to day. That is a separate question, covered by operating cash flow against liquidity, which the cash runway guide works through on its own terms.
Where This Goes Wrong
Two mistakes come from skipping the filings and reasoning from orbit class alone. The first is assuming GEO fleets always outlive LEO ones because each satellite costs more and the fleet is replaced less often in aggregate; Iridium’s own 17.5-year figure is longer than EchoStar’s stated GEO range and beats the top of Viasat’s, so that assumption fails on the filed evidence. The second is reading one build-year capex ratio as though it were the operator’s permanent run rate. Iridium’s own guidance describes the opposite: a defined plateau of lower capital expense that it expects to hold until at least 2031, with the heavy spend confined to the build years either side of it.
Space & Satellites Sector Primer
Revenue ramp, margin and capex are the inputs. This primer takes both a pre-profit builder and a profitable operator to a discounted cash-flow value against an EV/sales screen.
The Excel model is the primer's two worked valuations live across 12 sheets: a ten-year free-cash-flow DCF for a profitable operator, and a pre-profit ramp builder that fades losses to a target margin, each with a cash-runway and capex bridge. Change the growth path, the exit multiple or the capex intensity and the value moves.
Frequently Asked Questions
- What is the real economic difference between LEO and GEO satellite operators?
- Orbit class sets the shape of the capital cycle. A low-earth-orbit (LEO) operator needs dozens of satellites flying close to the planet to cover it, so it builds and replaces them together as one constellation programme: a large multi-year spend, then a long period of low capital expense until the next generation. A geostationary (GEO) operator covers a wide footprint from a handful of satellites parked much further out, so it replaces them one at a time on staggered schedules, and capex is lumpy per satellite rather than per constellation.
- Does a LEO satellite have a shorter design life than a GEO satellite?
- Not on the filed evidence. Iridium depreciates its LEO satellites over 17.5 years, having extended that estimate from 12.5 years in the fourth quarter of 2023. That is longer than EchoStar’s stated 12-to-15-year GEO design life and sits inside Viasat’s 7-to-17-year GEO depreciation range. Design life is a decision each manufacturer and operator makes for a given programme, not a rule that follows from the orbit.
- How much did Iridium’s NEXT constellation cost, and what did that money build?
- Iridium’s own fact sheet puts the full network upgrade at approximately $3 billion, covering design, build and launch of 66 operational satellites plus in-orbit spares. The programme started in 2010 and was completed in February 2019. Iridium’s FY2025 10-K says the company has been in a period of lower capital expense since, which it expects to continue until at least 2031.
- What altitude actually separates LEO from GEO?
- Iridium’s own 10-K gives the comparison directly: geostationary satellites sit roughly 22,300 miles above the equator, medium-earth-orbit satellites orbit between roughly 6,400 and 10,000 miles up, and Iridium’s own low-earth-orbit satellites fly between roughly 300 and 1,000 miles up. That altitude gap is why the two orbit classes end up serving different markets and needing different fleet sizes to cover the same planet.