Satellite Constellation Capex and Economics
Capex intensity vs operating burn in satellite economics: FY2025 filed ratios from Iridium 11.5% to Globalstar 201%, plus Kuiper and Iridium NEXT cost anchors.
Educational analysis for professional use. This guide is not investment advice or a recommendation to buy or sell any security, and it is not personalised.
Constellation Builds Are a Separate Wallet from Operating Burn
Satellite operators can show positive or improving EBITDA while investing heavily in the next orbital generation. Capex intensity (capex ÷ revenue) captures that split. Operating cash burn, covered in the cash runway guide, measures whether current operations fund themselves. Constellation capex measures whether the fleet being sold today is paid for yet.
Confusing the two is common, because a strong operating margin says nothing about who is paying for next year’s satellites. Viasat and Globalstar are the clearest filed contrast: one funds a heavy build largely from its own operating cash, the other from a customer’s prepayment. Both appear below with the full numbers. The economics only make sense when build spend and operating margin are modelled on separate lines.
Historical Build Anchors
Large constellations require multi-billion upfront commitments before service revenue scales:
| Programme | Disclosed scale | Status |
|---|---|---|
| Amazon Project Kuiper | >$10B stated investment (Jul 2020); 3,236 satellites (FCC) | Build phase |
| Iridium NEXT | ~$3B full network upgrade | Completed Feb 2019 |
| Starlink (SpaceX) | Not publicly filed | Private; no filed total |
These numbers set investor expectations for cycle length and funding risk. They do not replace filer-specific capex/revenue ratios in peer screens.
FY2025 Capex Intensity Across the Six-Name Set
Filed FY2025 capex, or purchases of property, plant and equipment (PPE) where a filer reports it that way, divided by revenue:
| Company | Capex intensity | Revenue | Capex / PPE ($M) | Phase read |
|---|---|---|---|---|
| EchoStar | 10.9% PPE | $15.0B | $1,642M PPE (+ $676M capitalised regulatory interest) | Maintenance-like PPE ratio; regulatory capitalisation separate |
| Iridium | 11.5% | $871.7M | $100.3M | Post-NEXT maintenance |
| Planet | 20.3% | $244.4M | $49.6M | Active fleet refresh |
| Viasat | 22.0% | $4.52B | ~$1.0B | Active refresh / expansion |
| Rocket Lab | 26.0% | $601.8M | $156.3M PPE/software | Launch + systems build |
| Globalstar | 201.0% | $273.0M | $550.4M | Constellation-build extreme |
Fiscal calendars differ: Viasat year ended 31 Mar 2025; Planet 31 Jan 2025; others calendar 31 Dec 2025.
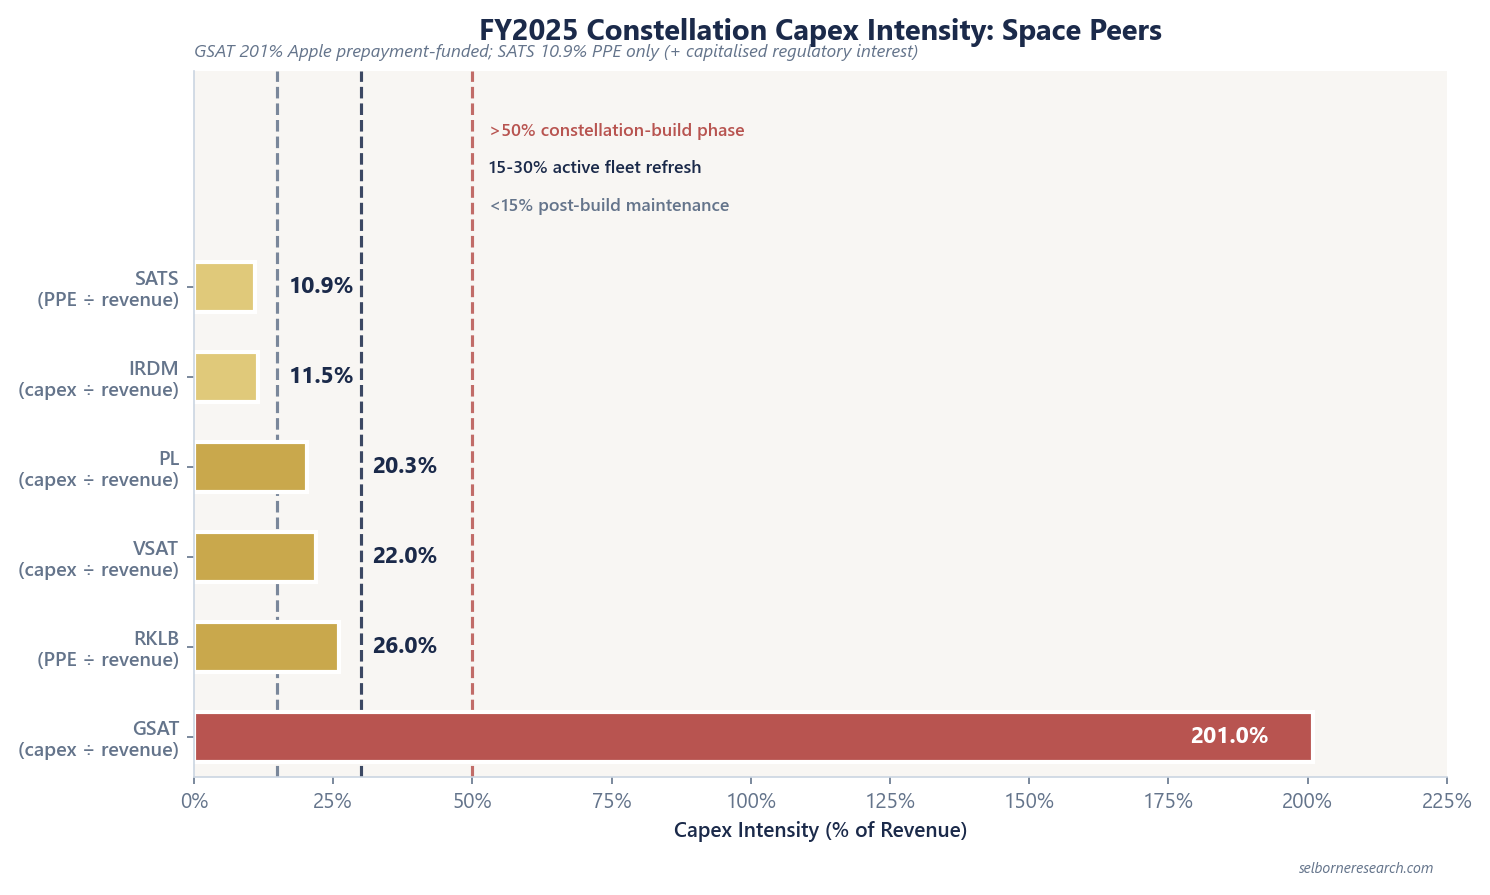
Capex Intensity Screening Bands
| Band | Range | Filed anchors |
|---|---|---|
| Post-build maintenance | <15% | IRDM ~11.5%; SATS PPE 10.9% |
| Active fleet refresh | 15-30% | VSAT 22%; PL 20%; RKLB 26% |
| Constellation-build phase | >50% | GSAT 201% |
Above 50% signals a network still being paid for upfront. Globalstar is the live filed extreme, not a theoretical stress case.
Globalstar: Prepayment-Funded Build at 201%
Globalstar combines high capex intensity with contracted funding:
| Item | FY2025 | Read |
|---|---|---|
| Revenue | $273.0M (+9%) | Apple wholesale 63% |
| Adjusted EBITDA | $136.1M (50% margin) | Operating economics work |
| Capex | $550.4M | 201% of revenue |
| Deferred revenue | $869M | Largely Apple prepayments |
| Mobile satellite services (MSS) subscribers | 791K | IoT average revenue per user (ARPU) $4.21; SPOT $13.97 |
Apple prepayments fund the constellation build that high capex intensity flags. Without the $869M deferred revenue balance, 201% capex/revenue would imply aggressive equity needs. The Globalstar profile is the wholesale-contract economics case; cross-check the EV/sales read in the valuation guide.
Viasat: EBITDA-Positive, Capex-Heavy, GAAP-Loss
Viasat illustrates operating cash generation during a heavy build:
| Item | FY2025 (Mar-25 YE) | Read |
|---|---|---|
| Adjusted EBITDA | $1.55B (34.2% margin) | Operator economics at EBITDA |
| GAAP net loss | $(575)M | Non-operating / accounting drag |
| Operating cash flow | +$908M | Cash-generative at operating level |
| Capex | ~$1.0B (~22% of revenue) | Active refresh band |
| Firm backlog | $3.55B | Defence $984M |
Defence backlog provides multi-year visibility separate from constellation capex timing. See the government backlog guide and Viasat profile.
Iridium: Post-Build Maintenance at ~11.5%
After Iridium NEXT (~$3B historical cost, completed 2019), capex fell to maintenance levels:
| Item | FY2025 | Read |
|---|---|---|
| Operational EBITDA (OEBITDA) | $495.3M | Profitable operator |
| Capex | $100.3M (~11.5% of revenue) | Post-build band |
| Subscribers | 2.54M | Voice, IoT, broadband ARPU disclosed |
| EMSS (Enhanced Mobile Satellite Services) contract | $738.5M over 7 years | Government anchor |
Iridium is the contrast case for mature LEO economics. Capex has stopped dominating the story, and subscribers and OEBITDA carry it instead. The Iridium profile pairs with the business models guide.
Modelling Constellation Economics
- Split operating profit and loss (EBITDA and operating cash flow, OCF) from investing capex on the cash-flow statement.
- Compute capex ÷ revenue and map to screening bands (<15 / 15-30 / >50%).
- Identify funding source: equity, debt, customer prepayments (GSAT), or operating cash (VSAT OCF +).
- Cross-check backlog or deferred revenue for visibility on who pays for the build.
- Do not use net loss as a proxy for build spend; use filed capex and disclosed prepayments.
Rocket Lab at ~26% sits in active refresh while still loss-making at adjusted EBITDA ($(101.2)M). Planet at ~20% is refreshing a data constellation with backlog $503.7M. The percentage alone does not say who is funding the build; the funding line item does.
Space & Satellites Sector Primer
Revenue ramp, margin and capex are the inputs. This primer takes both a pre-profit builder and a profitable operator to a discounted cash-flow value against an EV/sales screen.
The Excel model is the primer's two worked valuations live across 12 sheets: a ten-year free-cash-flow DCF for a profitable operator, and a pre-profit ramp builder that fades losses to a target margin, each with a cash-runway and capex bridge. Change the growth path, the exit multiple or the capex intensity and the value moves.
Frequently Asked Questions
- What is capex intensity in satellite companies?
- Capital expenditures (or purchases of property, plant and equipment and software) divided by revenue in the period. FY2025 filed points: Globalstar 201%, Viasat ~22%, Planet ~20%, Rocket Lab ~26%, Iridium ~11.5%, EchoStar PPE 10.9% of revenue (plus $676M capitalised regulatory interest). The ratio separates upfront constellation spend from operating burn on the income statement.
- Why can capex exceed 100% of revenue without equity dilution?
- Globalstar is the filed example: $550.4M capex on $273.0M revenue (201%) while Apple prepayments created $869M deferred revenue. Customer prepayments fund orbital capacity builds that would otherwise drain equity. Operating EBITDA was $136M (50% margin) in the same year. High capex intensity alone does not imply distress if funding is contracted.
- What capex intensity bands apply to space operators?
- As a working convention this guide states rather than sources: above 50% of revenue = constellation-build phase (GSAT 201% is the live extreme); 15-30% = active fleet refresh (VSAT 22%, PL 20%, RKLB 26%); below 15% = post-build maintenance (IRDM ~11.5% after Iridium NEXT). SATS at 10.9% of property, plant and equipment (PPE) looks maintenance-like but carries separate capitalised regulatory interest.
- How do historical constellation costs compare to current filers?
- Context peers: Amazon stated more than $10B for Project Kuiper (FCC authorisation for 3,236 satellites, July 2020). Iridium NEXT completed February 2019 at roughly $3B for the full constellation upgrade. Starlink total capex is not publicly filed (SpaceX private). Filed FY2025 intensity across the six-name set spans 10.9% to 201%, not a single sector average.