Government Revenue Share Across Space Stocks
FY2025 government revenue share ranked across space stocks, with the basis behind each filed figure and the two names that do not disclose the split.
Educational analysis for professional use. This guide is not investment advice or a recommendation to buy or sell any security, and it is not personalised.
The Government Share Tells You Whose Decisions Move the Revenue Line
A space company’s government revenue share is a proxy for how much of its top line depends on programme funding decisions and recompetes rather than ordinary commercial demand. A high share means appropriations cycles, contract renewals and a handful of agency relationships matter more to next year’s revenue than a sales pipeline does. A low share means the opposite: the business lives or dies on commercial customers who can walk at any renewal.
Only three of the six FY2025 filers in this set publish that split as a clean percentage. Ranking them without saying so, or quietly dropping the three that don’t file it, both mislead. This guide ranks what is filed, states the basis behind every figure, and keeps the unfiled names in the table rather than out of it.
Filed Government Revenue Share, Ranked
| Rank | Company | Government revenue share | Basis | Filed? |
|---|---|---|---|---|
| 1 | Iridium | 29% ($257.0M) | Revenue, US government direct + indirect | Yes |
| 2 | Rocket Lab | ~28% | Revenue, government customer channel | Yes |
| 3 | Viasat | ~18% | Revenue, US government segment (FY ended 31 Mar 2025) | Yes |
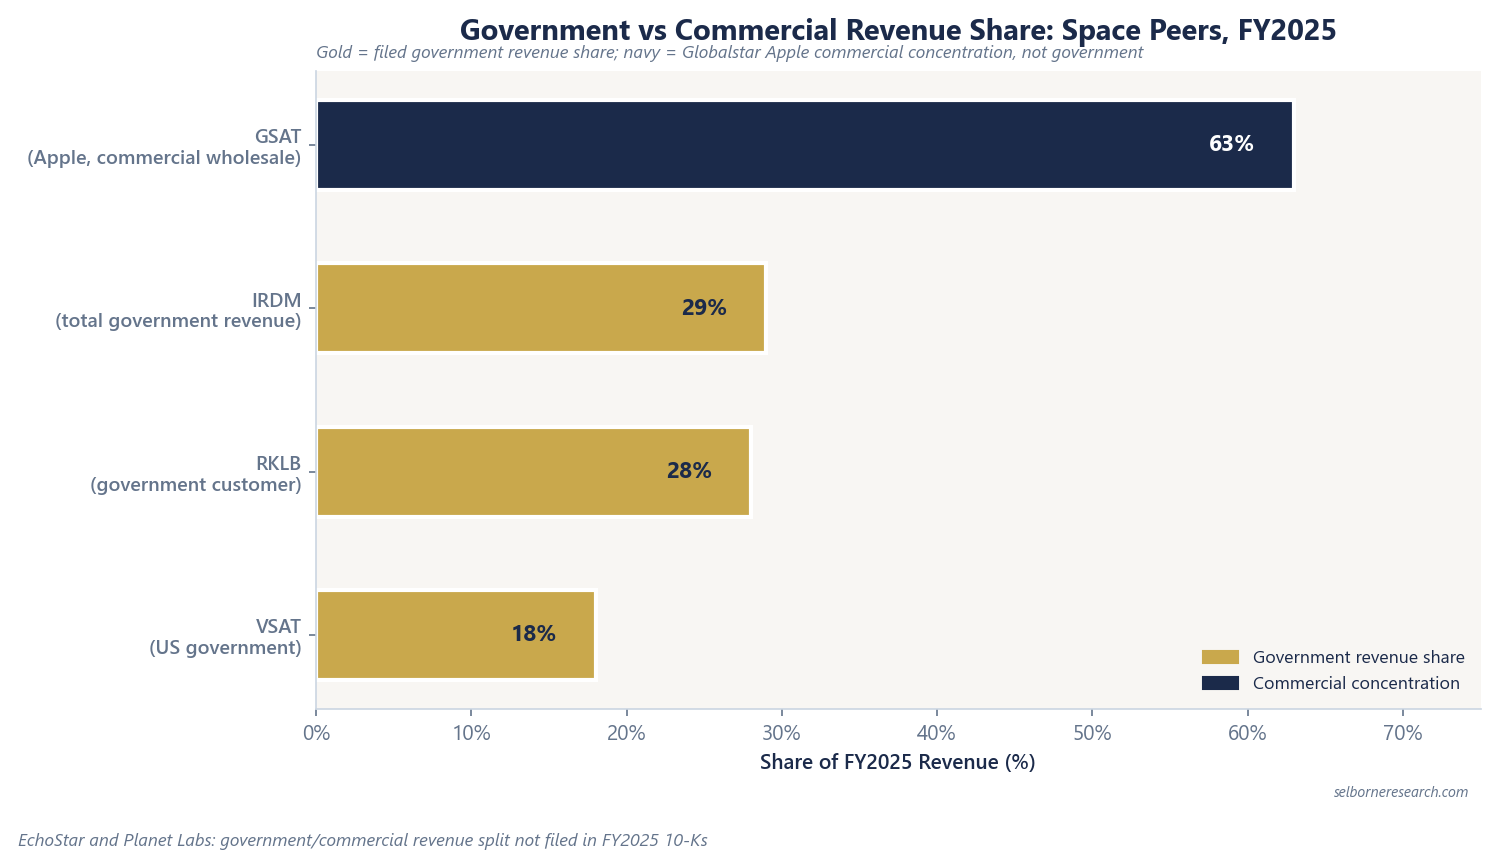
Iridium’s figure is the broadest of the three: it counts direct and indirect US government revenue together, of which the disclosed service-government component alone was $108.0M. Rocket Lab and Viasat each report a single government line without that direct/indirect split. None of the three states a forward trajectory, so the ranking reflects one filed year rather than a trend.
The Apple Mirror Case: Globalstar’s Commercial Concentration
Globalstar sits at the opposite end of the same table for a different reason. Apple wholesale capacity was 63% of Globalstar’s FY2025 revenue, the highest single-customer concentration in the set, but it carries none of the recompete mechanics a government contract does. There is no appropriations cycle and no competing bidder; the risk is renewal and payment terms with one commercial counterparty.
That distinction shows up on the balance sheet too. Globalstar’s $869M of deferred revenue is built almost entirely from Apple prepayments ($62.0M current, $806.9M non-current), which is a very different kind of forward visibility from a government backlog line. A prepayment is cash already received against future service; a government backlog entry is a promise that still has to survive the next budget cycle. Mixing the two into one “visibility” number would flatten a real difference in what each figure is protecting against.
| Company | Concentration | Share of FY2025 revenue | Type |
|---|---|---|---|
| Globalstar | Apple wholesale capacity | 63% | Commercial, single counterparty |
| Iridium | US government (direct + indirect) | 29% | Government, multiple agencies |
| Rocket Lab | Government customer channel | ~28% | Government |
| Viasat | US government segment | ~18% | Government |
Two Names That Do Not File the Split
EchoStar and Planet Labs both sit in this six-name set and neither reports a government/commercial revenue split. Leaving them off the ranking entirely would look like a complete peer table when it is not; showing them as blank rows keeps the gap visible instead of hidden.
| Company | Government/commercial revenue split | Status | What is filed instead |
|---|---|---|---|
| EchoStar | Not disaggregated | Not filed | Pay-TV, wireless and Hughes broadband subscriber counts by segment |
| Planet Labs | Vertical split not filed | Not filed | Total backlog $503.7M; named NGA (National Geospatial-Intelligence Agency) contract |
EchoStar’s FY2025 10-K reports Pay-TV, wireless and Hughes broadband as its operating segments, none split by customer type. Planet Labs discloses that one customer was 19% of FY2025 revenue and carries a named government contract (below), but does not publish a vertical breakdown of the $244.4M total. Both facts are useful; neither is a government revenue percentage, and treating a backlog figure or a contract ceiling as a stand-in for one would overstate what the filing actually says.
The Anchor Programmes Behind Each Percentage
A revenue percentage says how much of last year’s sales came from government customers. It says nothing about which programme, how long it runs, or what happens at the next decision point. Each filer in this set discloses at least one named government anchor, and the basis differs by company: a slice of a firm backlog total, a single prime contract, or a fixed-price service agreement.
| Company | Anchor | Basis | Scale |
|---|---|---|---|
| Viasat | Defence and advanced technologies backlog | Backlog | $984.0M of $3.55B firm backlog (~28%) |
| Rocket Lab | SDA (Space Development Agency) Tracking Layer Tranche 3 prime | Single contract | $816M for 18 satellites |
| Iridium | EMSS (Enhanced Mobile Satellite Services) | Single contract | $738.5M over 7 years; $110.5M/yr fixed through Sep 2026 |
| Planet Labs | NGA Luno B IDIQ (indefinite-delivery, indefinite-quantity) | Single contract ceiling | $200M (five-year base) |
Viasat’s number is a slice of a larger pool: $984.0M sits inside $3.55B of firm backlog built up across many contracts, so it moves as that whole backlog moves. Rocket Lab and Iridium’s figures are single named contracts, easier to track individually but each exposed to a single recompete or renewal date rather than a portfolio of them. Planet’s $200M caps what the agency could order under the contract; it is a ceiling, distinct from revenue already booked. Fiscal year-ends also differ across this set: Viasat’s year ends in March, Planet’s in January, and the rest run to a December calendar year-end, so “FY2025” does not mean the same twelve months for every row in these tables.
Where a Naive Ranking Goes Wrong
The same mistake that trips up a book-to-bill comparison (new orders against revenue billed in the same period) shows up here: stacking figures with different denominators in one column and reading them as directly comparable.
Revenue share and backlog share answer different questions even for the same company. Viasat’s US government revenue was ~18% of total FY2025 revenue, while its defence backlog was ~28% of firm backlog. Both numbers are correct and both describe Viasat’s government exposure, but they are not the same measurement, and averaging or blending them would produce a figure nobody filed.
A single contract value is a different kind of number again. Rocket Lab’s $816M SDA prime is spread over the life of a satellite build programme; turning it into a percentage of any one year’s revenue means picking an allocation the filings don’t specify. Putting $816M in the same column as Iridium’s 29% suggests a comparison that doesn’t exist without first converting both to the same basis.
Reading the Split Into a Model
Government revenue share is a starting screen; the anchor table behind it carries the rest of the risk read. A 29% government share at Iridium, spread across the EMSS contract and other agency work, carries a different concentration profile from a single 28% figure resting on one Rocket Lab prime contract due for its next tranche decision. The percentage alone doesn’t distinguish diversified government exposure from a single named programme.
Pair this split with how the company actually monetises: the layer a company sits in (launch, connectivity operator, or data licensing) sets which metrics apply in the first place, covered in the business models guide. Backlog definitions and the 30% concentration screen get a fuller treatment in the government backlog guide, and pre-profit names carrying government-anchored revenue still need a runway check against their own cash burn, in the cash runway guide.
Space & Satellites Sector Primer
Revenue ramp, margin and capex are the inputs. This primer takes both a pre-profit builder and a profitable operator to a discounted cash-flow value against an EV/sales screen.
The Excel model is the primer's two worked valuations live across 12 sheets: a ten-year free-cash-flow DCF for a profitable operator, and a pre-profit ramp builder that fades losses to a target margin, each with a cash-runway and capex bridge. Change the growth path, the exit multiple or the capex intensity and the value moves.
Frequently Asked Questions
- Which space companies disclose a government revenue share?
- Three of the six FY2025 filers we track: Iridium at 29% (US government direct and indirect, $257.0M), Rocket Lab at ~28% (government customer channel) and Viasat at ~18% (US government segment). EchoStar and Planet Labs do not file a government/commercial revenue split.
- Why does Globalstar's 63% Apple share not count as government revenue?
- It is the opposite case: commercial wholesale concentration in a single counterparty rather than government exposure. Apple capacity was 63% of Globalstar's FY2025 revenue, with $869M of deferred revenue built from Apple prepayments. The risk it carries is contract renewal and prepayment timing, a different exposure from a defence recompete.
- What government contracts anchor space company backlogs?
- Viasat carries $984.0M of defence and advanced technologies backlog inside a $3.55B firm backlog total (about 28%). Rocket Lab holds the Space Development Agency Tracking Layer Tranche 3 prime contract at $816M for 18 satellites. Iridium's anchor is the EMSS contract, $738.5M over seven years at a fixed $110.5M a year through September 2026. Planet Labs holds a $200M five-year National Geospatial-Intelligence Agency data ceiling.
- Why do EchoStar and Planet Labs not report a government revenue split?
- Neither files a gov/commercial revenue table. EchoStar's FY2025 10-K does not disaggregate its Pay-TV, wireless and Hughes broadband segments by customer type. Planet Labs discloses total backlog of $503.7M and a named National Geospatial-Intelligence Agency contract but no vertical revenue split. Dropping them from a ranking would understate how much of the sector's revenue mix is simply unknown.