EBITDA per Tonne: Comparing Steel Producers
Learn how EBITDA per tonne compares steelmaker profitability, with the production and accounting traps that distort peer analysis.
Educational analysis for professional use. This guide is not investment advice or a recommendation to buy or sell any security, and it is not personalised.
One Number That Strips Out Scale
Comparing steelmakers on absolute EBITDA mostly tells you which one is bigger. ArcelorMittal shipped 54.0 Mt of steel in FY2025 against Cleveland-Cliffs’ 16.2M net tons, so scale settles that comparison before profitability gets a say. Dividing EBITDA by tonnes shipped strips the scale out and leaves a single per-unit profitability figure that can be lined up across producers, business models and geographies.
That makes EBITDA per tonne the cleanest first-pass comparison in the sector. It is also one of the easiest to get wrong. Two definition choices sit underneath it: the unit of weight, which moves the answer by about 10%, and the shipment basis, which moved Nucor’s FY2025 figure by 27%. The ladder comes first; the two traps follow.
The FY2025 Ladder
Three large listed steelmakers filed full-year results that span $210 per ton down to roughly $2. Every figure below is from the companies’ own FY2025 results releases.
| Producer | FY2025 EBITDA | Shipments | EBITDA per tonne/ton |
|---|---|---|---|
| Nucor (NUE) | $4,174M | 19.848M short tons (external) | ~$210/ton |
| Nucor (NUE) | $4,174M | 25.271M short tons (total segment) | ~$165/ton |
| ArcelorMittal (MT) | $6,541M | 54.0 Mt (metric, group) | $121/t |
| Cleveland-Cliffs (CLF) | $37M (adjusted) | 16.229M net tons | ~$2/ton |
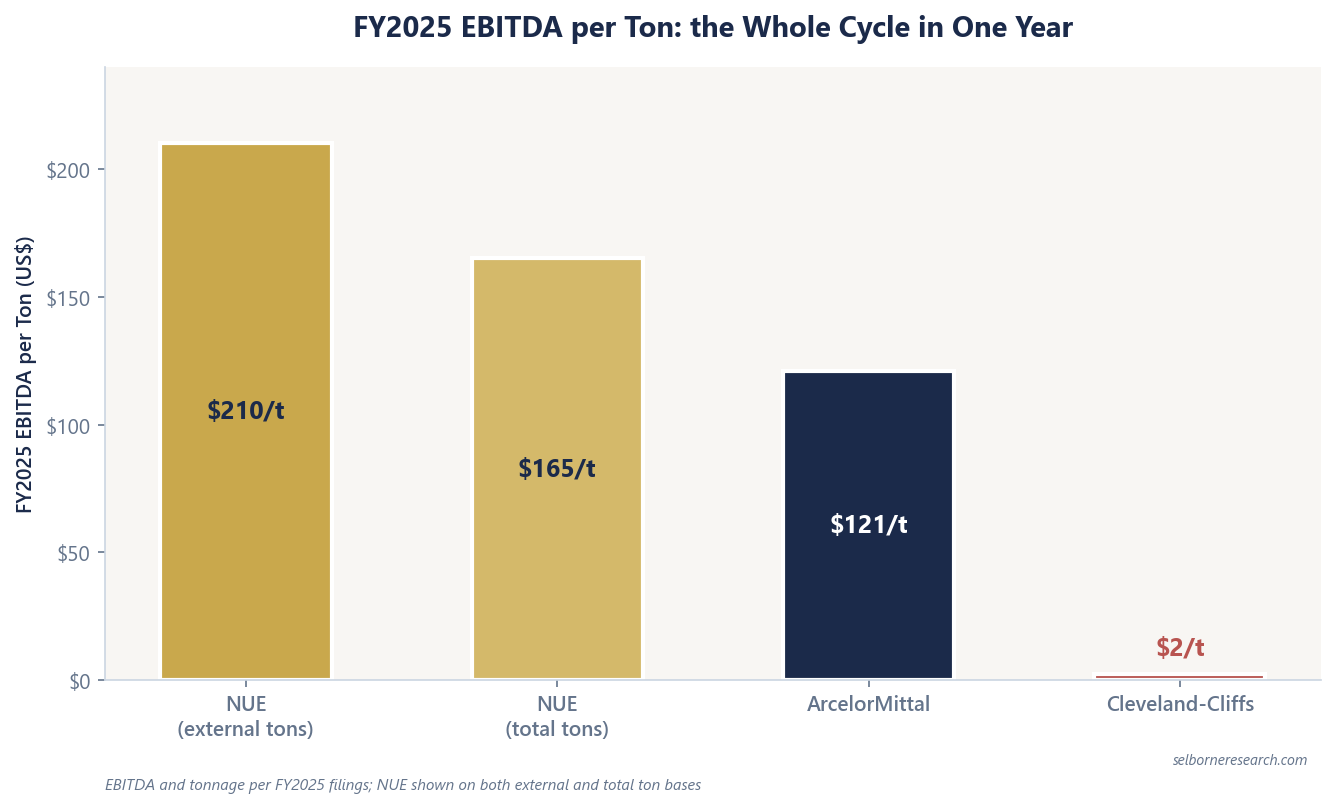
The arithmetic is deliberately simple. $4,174M divided by 19.848M tons is $210.30; $6,541M divided by 54.0 Mt is $121.13; $37M divided by 16.229M tons is $2.28. The hard part is making sure the numerator and denominator mean the same thing for every company in the table, which is where the two traps come in.
Trap One: Short Tons Are Not Metric Tonnes
US producers report in short tons; almost everyone else reports in metric tonnes, and mixing them silently builds a 9-10% error into the comparison.
A short ton is 2,000 lb, which is 0.9072 metric tonnes. Nucor, Cleveland-Cliffs and Warrior Met Coal report short tons, and the US price marks they sell against (Midwest HRC, shredded scrap) quote per short ton. ArcelorMittal, Vale and Fortescue report metric tonnes, as do the seaborne iron ore and coking coal benchmarks.
Put Nucor’s external-basis figure onto a metric basis and it rises from $210.30 per short ton to about $232 per metric tonne, because a metric tonne is roughly 10% more steel. Run the conversion the other way and ArcelorMittal’s $121/t becomes about $110 per short ton. The ranking in the ladder above survives the conversion comfortably, but in a tighter comparison, say two producers $15 apart, a 10% unit error is enough to flip the order.
The practical rule: keep every figure in the unit the company reports, label each row of your comparison table, and convert only at the moment you place two producers side by side. Converting everything to one unit early and silently is how spreadsheets quietly go wrong.
Trap Two: Which Shipments Go in the Denominator?
The same company, the same year and the same EBITDA can produce two materially different per-ton figures depending on whether the denominator counts internal transfers.
Nucor is the clearest illustration because it discloses both bases. Its FY2025 steel mills segment shipped 25.271M tons in total, of which 19.848M tons went to external customers; the rest moved internally into Nucor’s own downstream products businesses. Against $4,174M of EBITDA, that is $165 per ton on the total basis or $210 per ton on the external basis. Same company, same profit, a 27% gap.
Neither figure is wrong. The total basis measures profitability per ton of steel the mills actually made; the external basis measures it per ton sold to the outside world. What matters is consistency. ArcelorMittal’s headline 54.0 Mt is steel shipped to customers, so Nucor’s external 19.848M tons is the comparable denominator, and its $210 per short ton is the figure that belongs beside MT’s $121. Clear trap one as well and the honest pair is $232 against $121, both in metric tonnes. Quote Nucor at $165 instead and the gap between the two business models narrows because of a definition, not because of anything either company did.
Cleveland-Cliffs sidesteps the question, since its 16.229M net tons are external sales volumes. But for any vertically integrated producer with captive downstream demand, check the footnotes before dividing.
The Spread Is the Lesson, Not the Ranking
The interesting thing about the FY2025 ladder is not who sits on top. It is that three large, established steelmakers selling broadly similar products in the same year span $210 down to $2. That spread is route economics, not scale or management quality alone.
Nucor runs electric arc furnaces fed by scrap, and FY2025 was a year when the steel spread, the gap between US HRC prices and scrap costs, was wide and tariff-supported. ArcelorMittal earns almost none of that US spread: it sold its US mills to Cleveland-Cliffs in 2020, and just over half its shipments are now European, where spreads are thinner. Its $121/t is a global blend off a 74% blast-furnace fleet. Cleveland-Cliffs, an integrated BF-BOF producer with roughly 30% of revenues tied to automotive, caught the bottom of its cycle: $18.6B of revenue produced just $37M of adjusted EBITDA and a $1.4B GAAP net loss. The same spread environment that paid Nucor $210 per ton left CLF at break-even.
The market prices this differential bluntly. At the 9 June 2026 close, Nucor’s market cap was about $57.9B against ArcelorMittal’s $50.4B, on a third of the tonnage.
A single year is a snapshot of the cycle, though, not a verdict. CLF’s assets did not change in 2025; its spread did. Which is why per-tonne comparisons should feed into a through-cycle valuation rather than being capitalised at face value.
What the Metric Hides
EBITDA per tonne deliberately ignores everything below the EBITDA line, and three of those omissions matter.
Sustaining capex. Steelmaking assets are expensive to keep running. ArcelorMittal’s FY2025 capex was $4.3B, of which $2.9B was sustaining, roughly $54 per tonne shipped. Set against $121/t of EBITDA, nearly half the per-tonne profit is spoken for before any growth spending, interest or tax. A producer with a high EBITDA per tonne and an old, capital-hungry fleet can generate less free cash per tonne than a leaner rival with a lower headline figure.
Per-tonne EBITDA also says nothing about who owns it. Cleveland-Cliffs carried about $7.2B of net debt at end-2025 against a market cap of roughly $7.25B (9 June 2026), so its equity is a leveraged claim on any spread recovery. Nucor’s net debt was around $4.4B against $4,174M of EBITDA, a much shorter ladder to climb.
Reinforcing bar and the coated sheet that becomes a car’s outer panel are not the same tonne even when the weight matches. Mix differences explain part of any per-tonne gap, and they shift over time as producers move up or down the value chain.
None of this makes the metric less useful. It makes it a screening tool rather than a valuation. Compute EBITDA per tonne on consistent units and shipment basis first; the spread across producers is the screening question. Normalised EBITDA and an EV/EBITDA framework come next if you need something resembling a price target.
Every time you write down a per-tonne figure, note the unit and the shipment basis next to it. The FY2025 Nucor case shows the same company can legitimately be $165 or $210, and a comparison table that does not say which one it is using is not a comparison table.
Steel & Bulk Commodities Primer
A per-tonne ladder ranks producers on one year of spread. The primer rebases each of them onto a through-cycle spread.
The Excel model is the primer's three worked DCFs live across 13 sheets: change the mid-cycle spread, utilisation or discount rate and the valuation moves.
Frequently Asked Questions
- How do you calculate EBITDA per tonne for a steel producer?
- Divide reported EBITDA by steel shipments for the same period, keeping both in the units the company reports. For FY2025: ArcelorMittal's $6,541M EBITDA over 54.0 Mt shipped gives $121 per metric tonne, Nucor's $4,174M over 19.848M external short tons gives roughly $210/ton, and Cleveland-Cliffs' $37M adjusted EBITDA over 16.229M net tons gives about $2/ton. Always check whether shipments are external only or include internal transfers, and whether the units are short tons or metric tonnes.
- Why does Nucor have two different EBITDA per ton figures for 2025?
- Because Nucor discloses steel mill shipments on two bases. Total segment shipments of 25.271M tons include steel sent internally to its own downstream products businesses; external shipments were 19.848M tons. The same $4,174M of FY2025 EBITDA therefore gives $165/ton on the total basis or $210/ton on the external basis. The external figure is the one comparable to ArcelorMittal's reported group shipments.
- What is the difference between a short ton and a metric tonne in steel reporting?
- A short ton is 2,000 lb, equal to 0.9072 metric tonnes. US producers such as Nucor, Cleveland-Cliffs and Warrior Met Coal report short tons, and US price marks (HRC, scrap) quote per short ton. ArcelorMittal, Vale, Fortescue and the seaborne iron ore and coking coal benchmarks all use metric tonnes. Comparing a per-short-ton figure directly against a per-metric-tonne figure builds in a 9-10% error before the analysis even starts.