Royalty vs Streaming Companies: Key Differences
Understand the business model differences between royalty and streaming companies, margin profiles, valuation, and how they compare to operating miners.
Educational analysis for professional use. This guide is not investment advice or a recommendation to buy or sell any security, and it is not personalised.
Introduction: The Royalty and Streaming Model
Royalty and streaming companies own cash flows from mining operations without bearing development, capital, or operational risk. They fund miners in exchange for contractual rights to portions of production or revenue.
Franco-Nevada and Wheaton Precious Metals (formerly Silver Wheaton) are the canonical examples, with market caps exceeding $30 billion each. Both trade at a premium to operating miners, so the buyer accepts a lower cash yield in exchange for cash flows that carry no cost risk and no capital call.
Royalty Companies: The Model
How Royalties Work
A royalty is a contractual claim on a percentage of mine revenue (or, less commonly, mine profits) for the life of the property. The royalty holder receives regular cash payments based on production and commodity prices.
Net Smelter Return (NSR) Royalties are the most common form:
- Royalty holder receives X% of net revenue (typically 0.5% to 3%)
- Net revenue = (Metal Price × Oz Produced) − Smelting/Refining/Transport Costs
- Royalty is payable quarterly or semi-annually
- Operator deducts treatment charges before calculating the royalty base
Profit-Based Royalties (less common) entitle the holder to X% of mine operating profit above a threshold:
- More sensitive to cost inflation and commodity prices
- Rarer because operators prefer NSR structure (simpler accounting)
Characteristics of Royalties
Capital Requirements: Minimal. The operator funds all exploration, development, and sustaining CapEx. The royalty holder writes a cheque for the royalty claim (or converts a loan), then sits back and collects cash.
Revenue Streams: Passive. Royalty companies have no control over production, costs, or capital allocation. Cash flows flow through automatically based on operator performance.
Diversification: Royalty portfolios typically span 20–100+ properties across multiple jurisdictions, commodities, and life-cycle stages (operating mines, development, exploration). This reduces single-asset risk.
Duration: Long, often 50+ years, with many properties in perpetuity (as long as ore is mined). This creates a quasi-annuity profile.
A Royalty Cash Flow Example
Property: Large copper-moly mine in Chile Operator: Major copper producer NSR Royalty: 3% of net smelter revenue Commodity: 450,000 tonnes/year of copper concentrate (25% copper grade)
Year 1 Production:
- Contained copper: 112,500 tonnes
- At the deck’s $11,000/tonne: 112,500 × $11,000 = $1,238 million
- Molybdenum credits: $50 million
- Smelting/transport deduction: $100 million
- Net smelter revenue: $1,188 million
- Royalty payment (3%): $35.6 million
This royalty company receives $36 million in cash without operating the mine, dealing with labour disputes, or funding $500 million in mine development.
Franco-Nevada in Practice
Franco-Nevada (FNV) invented the modern royalty company and remains one of the two that set the terms. With several hundred mining assets (up from roughly 190 at its 2007 IPO), Franco collects royalties and streams from:
- Tier-1 royalties and streams on mines operated by Newmont, Barrick, Agnico-Eagle, and Lundin Mining across Canada, Australia, Chile, and the US
- Diversified commodity exposure including gold, silver, copper, and energy royalties
- Exploration upside from early-stage royalties that may never produce
The shape of the business shows up in three numbers:
- Around half a million gold-equivalent ounces a year, attributable
- A head office costing a couple of per cent of revenue, because there are no mines to staff and no capital to deploy
- A cash margin near 90%, because the only real cost of sales is the contracted price paid for streamed metal
- A growing dividend, though the yield sits under 1% because the shares are priced on growth rather than income
Streaming Companies: An Evolution
How Streams Work
A metal stream is a financing instrument in which a streaming company funds a mine developer in exchange for the right to purchase a fixed percentage of future metal production at a contractual delivery price below market.
Key mechanics:
- Streamer pays developer an upfront cash payment (e.g., $500 million)
- In return, streamer has the right to buy X% of metal production at a contractual delivery price. Deals signed in the last decade set that price at 15–25% of spot; older contracts fixed it in dollars instead, and those legacy prices now sit far below any percentage-of-spot deal
- Metal is delivered to the streamer, who sells it at market prices
Example:
- Streamer pays the operator $1 billion upfront
- Streamer receives the right to 25% of the mine’s silver production
- Streamer buys that silver at 20% of spot, the going rate on recent deals
- Streamer sells it at $48/oz, keeping the $38.40 spread
- Profit: ~$38/oz × volume
Streaming vs. Royalty: Key Differences
| Aspect | Royalty | Stream |
|---|---|---|
| Upfront Payment | Typically smaller ($10–100M) | Larger ($100M–1B+) |
| Cost Basis | No ongoing capex | Delivery price, 15-25% of spot on recent deals, fixed dollars on legacy ones |
| Margin Profile | Fixed % of revenue | Spread between stream price and spot |
| Leverage | Passive cash collection | Active commodity price leverage |
| Counterparty Risk | Operator continues mining | Operator must keep delivering metal |
| Return on capital deployed | Royalty receipts against the price paid for the royalty | Spot-less-delivery-price spread against the upfront payment |
Wheaton Precious Metals in Practice
Wheaton (WPM) is the largest pure-play streaming company. Portfolio includes streams on:
- Vale (Salobo gold stream, Brazil; Sudbury and Voisey’s Bay, Canada)
- Hudbay Minerals (Constancia gold and silver stream, Peru)
- Glencore/BHP (Antamina silver stream, Peru)
- First Majestic (San Dimas gold and silver, Mexico)
Wheaton’s 2025 attributable production was ~690,000 gold equivalent ounces. Guidance for 2026 is 860,000–940,000 GEOs, a step up of roughly a third that comes from streams already signed rather than from any mine Wheaton operates.
Economics: Wheaton’s purchase costs have not kept pace with the gold price, because most of its revenue still comes from contracts that fix that cost in dollars. Fixed per-ounce payments covered 70% of first-quarter 2026 revenue. The largest of them, the Salobo gold stream, pays the lesser of market or about $400/oz, rising 1% a year since 2019. Only the newer deals price off spot: Kurmuk at 15% of the gold price, Antamina at 20% of the silver price.
That mix shows up in the blended figure. Wheaton paid $514 per gold-equivalent ounce in 2025 against a realised price of $3,554, a cash cost of 14.5% and a cash margin near 85%. Corporate costs run $50–80M a year, and the major streams have 15–30 years left to run. Fixed-dollar pricing is what makes a streamer a geared bull-market vehicle: every dollar on the gold price falls straight to margin, where a percentage-of-spot deal splits the gain with the operator.
Margin Profiles: Royalty vs. Streamer vs. Miner
Comparing gross margins across the three business models reveals the power of the royalty/streaming structure:
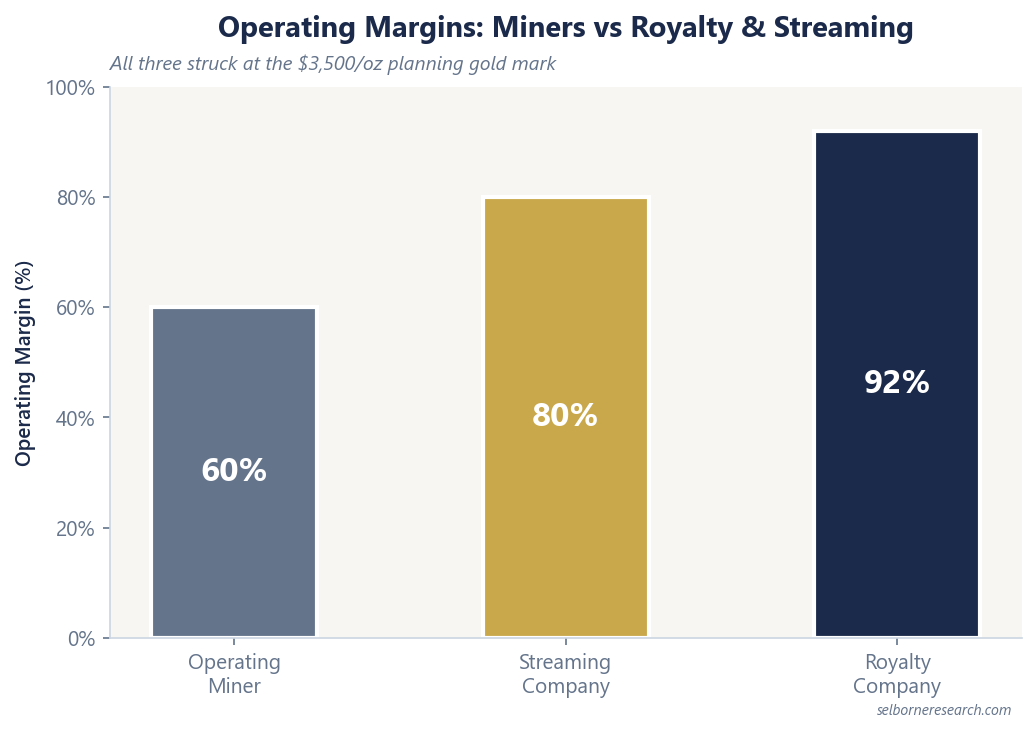
All three examples use the $3,500/oz planning gold mark for a like-for-like comparison:
Operating Gold Miner (Agnico-Eagle, Newmont):
- Revenue: $3,500/oz
- AISC: $1,400/oz
- Operating Margin: ~60% (before taxes)
Royalty Company (Franco-Nevada):
- Revenue: $105/oz in royalties (3% NSR on $3,500 gold)
- Operating Costs: ~$8/oz (allocated corporate overhead)
- Operating Margin: ~92% (before taxes)
Streaming Company (a new stream on current market terms):
- Purchase price: ~20% of gold price = ~$700/oz
- Sale at $3,500/oz
- Corporate overhead: ~$50–80/oz
- Gross Margin: ~80%
The gap widens as gold falls. Take gold 40% lower, at $2,100/oz: the miner’s margin roughly halves to 33%, while the royalty holder still keeps about 87%. A streamer holds up too, though how well depends on the contract. A percentage-of-spot deal keeps its margin near 79%, because the purchase price falls with the metal. A fixed-dollar stream compresses instead: it bought a cost that never rises, so a falling price eats into the spread. That asymmetry is the core of the investment case.
A royalty or stream company can stay profitable through a downturn deep enough to push a miner into losses. The spread narrows, but a lesser-of-market clause like Salobo’s stops it inverting: the streamer never pays more than the metal is worth.
Portfolio Diversification
Royalty and streaming companies gain diversification that few operating miners achieve:
Franco-Nevada’s revenue by commodity (approximate):
- Gold (~65%)
- Silver (~15%)
- Copper/PGMs (~12%)
- Energy and other (~8%)
By jurisdiction:
- Canada (~40%)
- Latin America (~25%)
- Australia/Pacific (~20%)
- Other (~15%)
Stage is a different cut, and it counts properties rather than revenue. Only about a quarter of Franco’s assets are producing; the other three quarters are development and exploration ground that earns nothing today and may never earn anything. Every dollar in the two splits above comes from that producing quarter.
This breadth reduces idiosyncratic risk. A single operating mine carries binary risk; Franco’s several hundred assets provide a substantial portfolio effect.
Note on Growth: Wheaton is projected to grow to ~1.2M GEOs by 2030, driven by new streaming agreements signed in 2024-2025. That is roughly three-quarters more than it produced in 2025, and it is what distinguishes Wheaton from Franco, whose portfolio production is relatively stable.
Valuation Approaches
NAV for Royalty/Streamer Companies
Similar to mining NAV methods, royalty NAV calculates the present value of all cash flows from royalties and streams:
Royalty NAV Formula: NAV = Σ PV(Annual Royalty Payments) − PV(Corporate Costs)
A crude version of that sum, at $3,500/oz gold and on Franco’s producing book alone:
- Attributable production: around 500,000 gold-equivalent ounces a year
- Revenue: 500,000 × $3,500 = $1.75 billion
- Cash margin at 90%, the level the company reports: ~$1.6 billion a year
- Discounted at 5% over 40 years, an annuity factor of 17.2: ~$27 billion
Treat that as a floor, not an answer. It values a diversified royalty book as one flat annuity, which no analyst would defend: a real sum-of-parts runs each asset on its own mine plan, reserve life and jurisdiction-appropriate discount rate. More to the point, it prices only the producing quarter of the portfolio and gives nothing at all for the three quarters still in development or exploration.
That gap is most of why the shares carry a premium. Franco’s market capitalisation runs well above a producing-asset NAV of this size, and what the market is paying for is the optionality the annuity ignores. Move the gold input and the whole thing scales close to linearly, so substitute your own long-term price and re-run before arguing about the multiple.
P/NAV Multiple Analysis
A P/NAV multiple means nothing until you know the gold price the NAV was struck at. That single input drives the denominator, so the same company can look fairly priced or expensive depending on a number buried in someone else’s spreadsheet.
Strike the NAV at spot gold and the denominator is large, so the multiple lands near 1.0. Strike it on a conservative long-term price, as our sector primer does at $3,500/oz, and NAV shrinks while the share price does not. The worked portfolios in that primer land at 1.38x for the five-royalty book and 1.75x for the three-stream book on that deck.
On a consistent deck, royalty and streaming companies sit at a premium to operating miners rather than a discount. Our own mining work screens fair-value senior producers around 0.8 to 1.1x. The gap is what the market pays for margin that survives a downturn and for cash flow that never comes with a capital call.
So read the multiple against the group’s own band, not against 1.0. Where a company sits inside it moves with:
- Gold outlook (bull markets push the whole band up)
- Recent M&A sentiment, and whether the last deal looked accretive
- Dividend policy
EV/Stream Revenue Multiple
For streaming companies, EV/stream revenue is sometimes used:
EV = Market Cap + Net Debt
Divide whatever enterprise value the market is assigning on the day you run it by Wheaton’s 2025 stream revenue of $2.3 billion. A $46 billion EV gives 20x; a $56 billion EV gives 24x.
Those multiples look expensive against anything you would pay for a miner’s revenue, and they should. Far more of each revenue dollar reaches a streamer’s cash margin. Compare EV/revenue only within the royalty and streaming group, never across to producers.
Risks and Limitations
Royalty/Streaming Risks
No Share in Cost Savings: An NSR royalty pays on revenue, so cost cuts are worth nothing to the holder. Drop a mine’s AISC by 30% and the operator’s cash flow soars while the royalty cheque sits unchanged. Extra ounces are the exception: a royalty scales one-for-one with production, just not with efficiency.
Counterparty Risk: If the operator faces financial distress or bankruptcy, the royalty may be at risk. Streams are secured by liens on production, but still carry operator credit risk.
Commodity Price Sensitivity: Low costs are not low price exposure. A royalty is a slice of somebody else’s revenue, so a 20% fall in gold takes about 20% off the cheque, and there is no cost line to cut in response. A fixed-dollar stream is geared harder still, because the delivery price stays put while the sale price falls: at $3,500/oz gold against a $400/oz Salobo-style delivery price the spread is $3,100, and gold at $2,800 leaves $2,400, a 23% fall from a 20% move in the metal.
Growth Constraints: Unlike miners, royalty companies can’t grow production by optimising their own operations. Growth comes only from acquiring new royalties/streams or from operators expanding production on existing assets.
Exploration Risk: Exploration-stage royalties may never produce, and when they don’t, the write-off is small. Franco-Nevada wrote off $4.1 million of exploration assets in 2023 after explorers walked away from ground it held royalty rights over. That is the real scale of exploration attrition here: single-digit millions, because the royalty cost little to acquire in the first place. Franco’s one enormous write-down of that year, $1,169.2 million, was not geology. It was the Cobre Panama stream taken to nil after Panama’s Supreme Court voided the mine’s concession, and $4.8 million of it came back as a reversal in 2025.
Operator-Held Royalties vs. Third-Party
Many royalties are operator-held: the miner retains a royalty on a property sold to a junior. These carry concentration risk and operational leverage tied to the original operator’s performance.
A third-party royalty is more insulated, but an individual royalty asset is hard to sell if you want out.
How to Integrate into Your Mining Analysis
For investors, Franco-Nevada and Wheaton offer:
-
Defensive Mining Exposure: Some investors use Franco-Nevada and Wheaton for gold/silver leverage with lower operating risk than miners. Contrast this to operating miners whose returns depend on AISC control. Often screened as a lower-operating-risk sleeve within a mining allocation.
-
Dividend Income: Both pay a rising dividend, but on yields under 1%, so the income is a signal of cash generation rather than a reason to hold the shares. The return case rests on capital appreciation, and share-price behaviour remains cycle-dependent.
-
Portfolio Ballast: In mining-heavy portfolios, a royalty or streamer sleeve has historically shown lower share-price volatility than operators while maintaining commodity exposure, though this is cycle-dependent and not assured.
-
M&A Optionality: Franco and Wheaton regularly deploy $500M–1B+ in new royalties/streams. Each deal adds to the book without adding overhead, which is where the growth comes from.
Where Royalty and Streaming Companies Fit
The trade-off is straightforward: you give up operating leverage for margin stability. In a gold bull market, Barrick and Newmont have historically tended to outperform Franco and Wheaton; in a downturn, the reverse has often held. The key question is always price. Near the top of the band our worked portfolios occupy, the margin advantage is already in the share price and you are buying deals that have not been signed yet.
Royalty & Streaming Sector Primer
Margin and risk separate a royalty from a stream. The primer values both as worked portfolios.
The Excel model is the primer's two NAVs live across 10 sheets: change the gold price, delivery percentage or discount rate and the valuation moves.
Frequently Asked Questions
- What is the difference between a mining royalty and a stream?
- A royalty is a percentage of revenue (typically 0.5% to 3% NSR) paid to the royalty holder on every ounce produced, with no ongoing costs. A stream is a contract to purchase a percentage of production at a contractual delivery price well below market: recent deals set it at 15-25% of spot, and older contracts fixed it in dollars (Wheaton's Salobo gold stream pays about US$400/oz). Royalties have zero cost exposure, while streams carry a small delivery cost.
- Why do royalty and streaming companies trade at premium valuations?
- Royalty and streaming companies carry no operating cost risk, no capital expenditure obligations, and no mine-level operating liabilities. They offer diversified exposure to multiple mines and commodities with high margins (around 80% for streamers, above 90% for royalty holders), predictable cash flows, and dividend growth. The market pays a premium to net asset value for that, where operating miners trade near or below their NAV. How large the premium looks depends on the gold price the NAV was struck at: on a conservative $3,500/oz planning deck, the worked royalty and streaming portfolios in our sector primer land at 1.38x and 1.75x.
- How do you value Franco-Nevada or Wheaton Precious Metals?
- The standard approach is a sum-of-parts NAV model where each royalty or stream asset is valued individually using the underlying mine's production profile, commodity price assumptions, and a jurisdiction-appropriate discount rate. The aggregate NAV is then compared to the share price. These companies normally trade at a premium to NAV, and the size of that premium depends heavily on the long-term gold price used to build it.