Mining Discount Rates by Jurisdiction: A Reference Guide
How to select WACC and discount rates for mining projects across Tier-1 to Tier-4 jurisdictions, with worked examples and country risk premium adjustments.
Educational analysis for professional use. This guide is not investment advice or a recommendation to buy or sell any security, and it is not personalised.
Why Discount Rates Matter
The discount rate (weighted average cost of capital, WACC) in a DCF valuation is the one input an analyst chooses rather than measures, and mine life decides what that choice costs. Discount a level ten-year cash flow at 7% instead of 6% and net present value falls about 4.6%. Run the same profile out to twenty years and the same 100 bps costs nearer 7.6%; on a development project, where the spending comes first and the ounces years later, more again.
Mining projects carry risks most industries do not:
- Political instability and unexpected regulation
- Commodity price shocks
- Geological surprises (grades, ore depth)
- Capital cost overruns (common in construction)
- Labour disruption and wage inflation
Getting the discount rate wrong by 200 bps costs roughly 9% of a ten-year mine’s NPV and 14% of a twenty-year one. This guide covers jurisdiction risk, mine stage adjustments, and commodity volatility, with worked WACC calculations for each tier.
The WACC Formula and Mining Adjustments
One thing to settle first. Technical reports quote discount rates in real terms, because the cash flows in a feasibility study are built at constant prices. A CAPM build starts from a government bond yield, so it gives you a nominal one. Discount real cash flows at a real rate, nominal at nominal, and do not cross the two.
Standard WACC is:
WACC = (E/V × Cost of Equity) + (D/V × Cost of Debt × (1 − Tax Rate))
Where:
- E/V = Equity weight (typically 70–80% for miners)
- D/V = Debt weight (20–30%)
- Cost of Equity = Risk-free rate + (Beta × Equity risk premium)
- Cost of Debt = Pre-tax borrowing rate (often 4–6% for junior miners, 3–4% for majors)
For mining, we often add a country risk premium on top of standard CAPM:
WACC = Base WACC + Country Risk Premium
In practice it enters in two places, not one: the premium goes on the cost of equity, and the cost of debt rises too, because lenders price the same risk.
The country risk premium varies from 0% (Canada) to 5–10%+ (high-risk jurisdictions).
A Tiered Framework: Four Categories of Jurisdictions
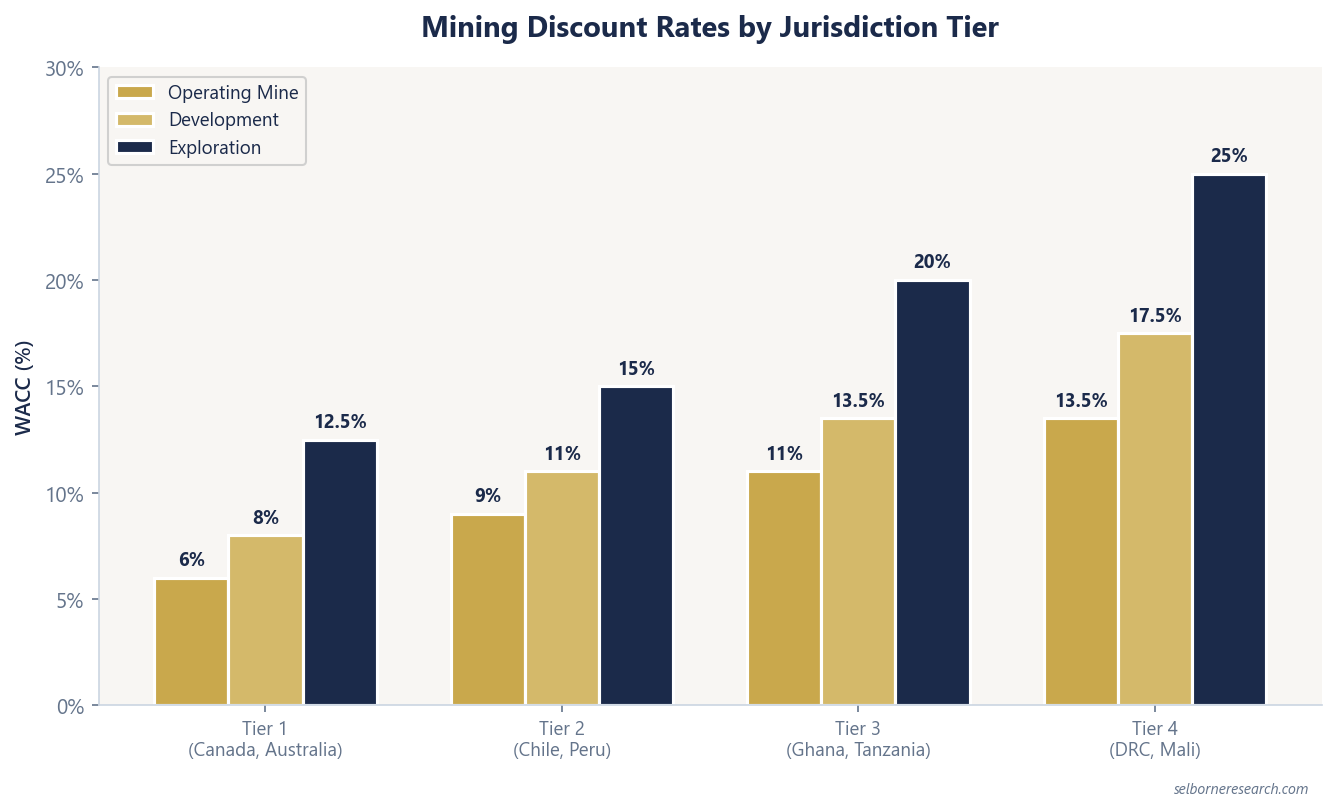
Tier-1: Stable, Developed Jurisdictions
Geography: Canada, Australia, USA, Scandinavia, Western Europe
Characteristics:
- Strong rule of law, stable government
- Predictable taxation and regulatory environment
- World-class infrastructure, skilled labour
- Low currency risk
- Track record of honouring mining contracts
Discount Rates:
- Operating mines: 5–7% WACC
- Development-stage projects: 7–9% WACC
- Exploration stage: 10–15% risk-adjusted rates
Example: Barrick operates Carlin, Cortez, and other mines in Nevada and Canada at a blended rate around 6–6.5%, which is where a large-cap miner in Tier-1 ground normally lands.
WACC Calculation for a Major Miner (Canada/Australia):
- Risk-free rate: 4.5% (US 10-year Treasury)
- Equity risk premium: 4.5%
- Beta: 1.2 (mining leverage)
- Cost of Equity: 4.5% + (1.2 × 4.5%) = 9.9%
- Cost of Debt: 3.5% (after-tax)
- Equity weight: 75%; Debt weight: 25%
- WACC = (0.75 × 9.9%) + (0.25 × 3.5%) = 8.3%
Shave 100–150 bps for operating mines with proven reserves and cost curves, reflecting lower geological risk and operational visibility. This de-risking adjustment is justified for projects with 10+ years of production history and demonstrated cost control. When applying this WACC to your cash flow model, combine it with disciplined AISC assumptions for realistic margin modelling:
- Base WACC for major Tier-1 miner (from calculation above): 8.3%
- Adjusted WACC for operating mine with 15+ year track record: 6.8–7.3% (100–150 bps reduction for operational de-risking)
A build like this lands at or above the top of its tier band, and the same is true of the emerging-market examples below. That is not an error in either number. The bands are what analysts actually apply to producing mines with a track record; the formula charges the full country premium against every year of cash flow. Screen on the band, and use the build only where you can defend each input in it.
Tier-2: Stable Emerging Markets
Geography: Chile, Peru, Mexico, Brazil, Colombia, Indonesia, Philippines
Characteristics:
- Functional legal systems and government stability
- Established mining industries and regulatory frameworks
- Commodity-dependent economies (susceptible to price cycles)
- Moderate currency risk (5–15% annual volatility)
- Occasional labour unrest or policy changes
Discount Rates:
- Operating mines: 8–10% WACC
- Development projects: 10–12% WACC
- Exploration stage: 12–18% risk-adjusted rates
Country Risk Premium: 2–3% above Tier-1
Example: Peru (Gold and Copper)
Peru is stable but carries fiscal risk. The government has raised mining taxes and threatened operational shutdowns over environmental concerns.
WACC Calculation for Peruvian Gold Mine:
- Risk-free rate: 4.5%
- Equity risk premium: 4.5%
- Beta: 1.3 (single-asset operator)
- Cost of Equity: 4.5% + (1.3 × 4.5%) = 10.35%
- Country Risk Premium: 2.5% (Peru political/currency risk)
- Adjusted Cost of Equity: 10.35% + 2.5% = 12.85%
- Cost of Debt: 5.0% (after-tax; higher borrowing cost in emerging markets)
- Equity weight: 75%; Debt weight: 25%
- WACC = (0.75 × 12.85%) + (0.25 × 5.0%) = 10.9%
Taking the 50–100 bps de-risking credit off that 10.9% gives 9.9–10.4%, so use 10% for an operating mine in Peru with stable production. Development runs 11–12%.
Tier-2 Adjustments by Country:
- Chile (most stable): 8–9.5% WACC for operating mines
- Peru (moderate risk): 9–10.5% WACC
- Mexico (security concerns): 10–11% WACC
- Brazil (size, political cycles): 9–11% WACC (varies by state)
Tier-3: Higher-Risk Emerging Markets
Geography: Ghana, Côte d’Ivoire, Tanzania, Guinea, Zambia, Democratic Republic of Congo (though Congo is often Tier-4)
Characteristics:
- Functional but less mature legal/regulatory frameworks
- Occasional policy reversals or sudden tax increases
- Labour instability and supply chain risks
- High currency devaluation risk (15–30%+ annually in some cases)
- Commodity-dependent economies; vulnerable to price shocks
Discount Rates:
- Operating mines: 10–12% WACC
- Development projects: 12–15% WACC
- Exploration stage: 15–25% risk-adjusted rates
Country Risk Premium: 4–6% above Tier-1
Example: Tanzania (Gold)
Tanzania hosts major gold mines (Barrick, AngloGold Ashanti). However, the country has a history of sudden tax changes and operational challenges.
WACC Calculation for Tanzanian Gold Mine:
- Risk-free rate: 4.5%
- Equity risk premium: 4.5%
- Beta: 1.4 (Tanzania mining, higher operating leverage)
- Cost of Equity: 4.5% + (1.4 × 4.5%) = 10.8%
- Country Risk Premium: 5% (Tanzania political/currency risk)
- Adjusted Cost of Equity: 10.8% + 5.0% = 15.8%
- Cost of Debt: 7.0% (after-tax; difficult borrowing in high-risk countries)
- Equity weight: 75%; Debt weight: 25%
- WACC = (0.75 × 15.8%) + (0.25 × 7.0%) = 13.6%
Taking the 50–100 bps de-risking credit off that 13.6% gives 12.6–13.1%, just above the 10–12% band. Use 12% for an operating mine and 13–14% for development.
Tier-3 Adjustments by Country:
- Ghana (established mining, stable government): 10–11% WACC
- Côte d’Ivoire (political volatility): 11–12.5% WACC
- Tanzania (tax policy uncertainty): 11–12.5% WACC
- Guinea (high risk, infrastructure): 12–14% WACC
- Zambia (debt crisis, currency): 12–14% WACC
Tier-4: Frontier/Conflict Zones
Geography: Democratic Republic of Congo, Mali, Burkina Faso, Chad, Yemen, Somalia, parts of Myanmar
Characteristics:
- Weak institutions, rule of law uncertain
- Political instability, civil conflict, or terrorism risk
- Minimal infrastructure; extreme supply chain disruption risk
- Currency at risk of collapse
- Expropriation risk or government renegotiation of contracts
Discount Rates:
- Operating mines: 12–15% WACC
- Development projects: 15–20%+ WACC
- Exploration stage: 25%+ (rarely funded)
Country Risk Premium: 6–10%+ above Tier-1
Example: Democratic Republic of Congo (Gold and Copper)
DRC is Africa’s largest copper producer by a wide margin, and a significant gold producer, but carries exceptional political risk. The country has expropriated assets, changed tax codes retroactively, and faces ongoing instability.
WACC Calculation for DRC Gold Mine:
- Risk-free rate: 4.5%
- Equity risk premium: 4.5%
- Beta: 1.5 (DRC mining, extreme operating leverage)
- Cost of Equity: 4.5% + (1.5 × 4.5%) = 11.25%
- Country Risk Premium: 8% (DRC expropriation/conflict risk)
- Adjusted Cost of Equity: 11.25% + 8.0% = 19.25%
- Cost of Debt: 10%+ (after-tax; borrowing near-impossible; refinancing risk)
- Equity weight: 75%; Debt weight: 25%
- WACC = (0.75 × 19.25%) + (0.25 × 10%) = 16.9%
Taking the 50–100 bps de-risking credit off that 16.9% gives 15.9–16.4%, above the 12–15% band. Use 15% for an operating mine in DRC, and only where it is majority-owned by a major miner. Development runs 16–17%.
For junior miners operating in Tier-4: Institutional investors often apply a 20%+ hurdle rate or simply avoid the investment due to tail risk.
Adjustments for Project Stage
Beyond jurisdiction, project stage materially impacts appropriate discount rates:
Operating Mine (Cash-Generating)
- Base WACC from jurisdiction (from above)
- Subtract 50–100 bps for de-risked cash flows
- Example: Canadian operating mine at 7% base → 6–6.5% applied rate
Development Project (Pre-Revenue)
- Base WACC + 100–200 bps (construction risk, operational ramp-up)
- Example: Peruvian development project at 10% base → 11–12% applied rate
Exploration Stage (High-Risk)
- Base WACC + 400–700 bps, or use probabilistic risk adjustment
- Example: Guinea exploration prospect at 12% base → 16–19% applied rate
- Alternative: Risk-adjust resources (assume 10% discovery success) and apply lower discount rate
Commodity Price Volatility and WACC
Some analysts adjust discount rates for commodity price volatility:
- Gold (lower volatility, ~15–20% annualised): Standard WACC
- Silver (moderate volatility, ~25–35% annualised): Add 50–100 bps
- Copper (cyclical, ~20–30% annualised): Add 50–150 bps
- Zinc, Nickel (volatile, cyclical, ~30–40% annualised): Add 100–200 bps
This is less common in institutional practice; most analysts stress-test price assumptions instead.
Cost of Equity Components
Risk-Free Rate
- Use the 10-year government yield in the relevant currency
- For USD-denominated mining: US 10-year Treasury (currently ~4.5%)
- For AUD-denominated (Australia mining): Australian government bond (~4.2%)
- For non-hedged international exposure: Add currency risk premium (0–2%)
Equity Risk Premium
- Global equity risk premium: 4–5% (historical average is 5.5%, but forward-looking estimates are lower)
- Use 4.5% for most mining valuations
- Some analysts use 5–6% for higher cyclicality; this is defensible but should be noted
Beta
- Gold miners (large-cap): 1.1–1.3. Above 1.0 reflects commodity-driven price swings, but golds are less volatile than juniors or base metals producers
- Diversified miners: 1.2–1.4. Broader commodity exposure adds cyclicality
- Junior miners: 1.5–2.0+. Leverage, single-asset risk, and thin liquidity drive higher betas
- Royalty/streaming companies: 0.9–1.1. Contracted cash flows dampen volatility relative to operators
Estimate beta from 3–5 year stock price regression against a broad index.
Currency Risk and Foreign Exchange
Mining projects often span currencies. Account for this in your WACC:
- USD revenue, largely USD costs: rare, and mostly limited to dollarised economies. No adjustment; standard WACC
- USD revenue, local-currency costs: the normal mining case. Metals sell in dollars while labour, power and contractors are paid locally, so a weakening local currency helps margins and a strengthening one hurts. Add 1–3% where that swing is large or the currency is unstable
- Hedged cash flows: No FX premium (contract locks price in home currency)
Sensitivity and Scenario Analysis
Given the importance of discount rate selection, always present sensitivity. This is particularly important in comprehensive valuation models:
Take a mine paying a level cash flow for ten years, worth $500M at 6%:
| WACC | 10-year annuity factor | NPV | Change |
|---|---|---|---|
| 6% | 7.360 | $500M | Base case (developed jurisdiction) |
| 8% | 6.710 | $456M | −8.8% at +200 bps (emerging market) |
| 10% | 6.145 | $417M | −16.5% at +400 bps (frontier) |
| 12% | 5.650 | $384M | −23.2% at +600 bps (high-risk) |
Read the middle column, because that is what does the work: the rate only reaches NPV through the annuity factor, and over ten years the factor is far less responsive than the rate. Misestimating jurisdiction risk by 200 bps therefore costs about 9% of value here, and about 14% on a twenty-year profile. Material, and worth arguing about with a colleague, but not the difference between a project and a write-off.
Common Mistakes and Practical Notes
Ad-hoc rates with no framework. The most common error is picking a round number (8%, 10%) without decomposing it. Show WACC components in your model so investors can replicate your logic and challenge specific inputs.
Static jurisdiction premiums. Country risk shifts as governments change. Peru raising mining taxes mid-project is worth 50+ bps. Update annually, not once.
Ignoring peers. If a peer with similar operations is valued at an implied 7% WACC and you are using 10% for the same asset, the gap needs an explanation. If it cannot be justified, the assumption is probably wrong.
Conflating systematic and idiosyncratic risk. WACC captures market and jurisdiction risk. Execution risk (construction delays, grade disappointments) belongs in scenario analysis or cash flow adjustments, not in the discount rate itself. Inflating WACC to capture everything at once masks where the real risk sits.
Putting It Into Practice
Start with base WACC from the CAPM calculation, add jurisdiction and stage premiums, then stress-test. The exact numbers matter less than whether you can defend each component to someone who disagrees. If your model uses 8% for a DRC copper project and a peer analyst uses 15%, that gap needs a conversation, not a shrug.
Jurisdiction sets the discount rate. The primer plugs that rate into a per-mine NAV.
The Excel model is the primer's two NAVs live across 12 sheets: change the gold price, ramp or discount rate and the valuation moves.
Frequently Asked Questions
- What discount rate is standard for mining project valuation?
- There is no single standard rate. Tier-1 jurisdictions (Canada, Australia, USA) typically use 5-7% real for producing assets, Tier-2 jurisdictions (Chile, Peru, Brazil) use 8-10%, and Tier-3 or Tier-4 jurisdictions (DRC, Mali, parts of Central Asia) may require 10-15% or higher to compensate for political and operating risk.
- What is a Tier-1 mining jurisdiction?
- A Tier-1 jurisdiction is a country with stable rule of law, well-established mining codes, transparent permitting processes, and minimal expropriation risk. Canada, Australia, and parts of the United States are the canonical examples. Mines in these jurisdictions command the lowest discount rates and the highest NAV multiples.
- How does political risk affect mining discount rates?
- Political risk adds a premium to the discount rate that reflects the probability of adverse government actions: higher royalties, windfall taxes, permitting delays, resource nationalism, or outright expropriation. This premium can range from 100 basis points for mild uncertainty to 500+ basis points for jurisdictions with a history of contract renegotiation.