Newmont (NEM)
The world's largest gold mining company following the Newcrest acquisition. Mine-by-mine NAV analysis using the Selborne mining framework.
Educational analysis for professional use. This profile is not investment advice or a recommendation to buy or sell any security, and it is not personalised.
Snapshot
Business Overview
Newmont bought its way to dominance, then immediately started selling pieces off. That tension defines the company. The November 2023 Newcrest acquisition, at a purchase price of $16.8 billion, was the largest gold mining deal ever done. It added Cadia (Australia), Lihir (Papua New Guinea), Brucejack and Red Chris (British Columbia) to an already sprawling portfolio, and lifted attributable gold production to 6.85 million ounces in 2024, the most Newmont has ever produced.
Management never intended to keep everything. Within months of closing, Newmont launched a divestiture programme aimed at the non-core end of the portfolio. By April 2025 six operations were gone: Telfer, CC&V, Musselwhite, Eleonore, Akyem, and Porcupine. Total announced proceeds reached up to $4.3 billion, $3.8 billion from the mines themselves and another $527 million from selling the shares and other investments taken as part-consideration. The result is a leaner company producing 5.89 million attributable gold ounces in 2025, plus 28 million ounces of silver and 135,000 tonnes of copper.
What remains is concentrated around a handful of Tier 1 assets. Australia and North America anchor the portfolio, with Mexico, Peru, Argentina, Ghana, Suriname and PNG making up the rest. The strategic logic is straightforward: own the best mines, fund them properly, and let the rest go to operators who value them more. Whether you agree depends on whether you think Newmont overpaid for Newcrest and is now cleaning up after itself, or whether the acquire-and-rationalise playbook was the plan from the start. What the 2025 numbers show is a company that got the balance sheet back in order faster than it promised.
How the Economics Work
The Newcrest deal reshaped Newmont's cost structure in ways that are still playing out. Start with the synergies: management promised $500 million in annual pre-tax savings within 24 months of closing, split roughly between $100 million in G&A, $200 million in supply chain, and at least $200 million from Newmont's Full Potential continuous improvement programme. They got there. On a $16.8 billion acquisition, $500 million of recurring pre-tax savings is material.
Full-year 2025 AISC, the all-in sustaining cost of getting an ounce out of the ground and keeping the mine running, came in at $1,358/oz on a by-product basis, down 4% from $1,408/oz in 2024. That basis credits the revenue from copper and silver against the cost of the gold, so it flatters a company with a big by-product stream. On a co-product basis, which splits the costs across all three metals instead, AISC went the other way: up 6% to $1,609/oz. Both are true, and they answer different questions. What genuinely lowered the group's cost per ounce was exiting the higher-cost mines. The record gold price did not, because royalties are levied on revenue and go up with it; Newmont realised $3,498/oz across 2025. For scale, the industry's production-weighted median AISC was near $1,709/oz at end-2025, so Newmont's by-product number sits in the lowest cost quartile and its co-product number in the second.
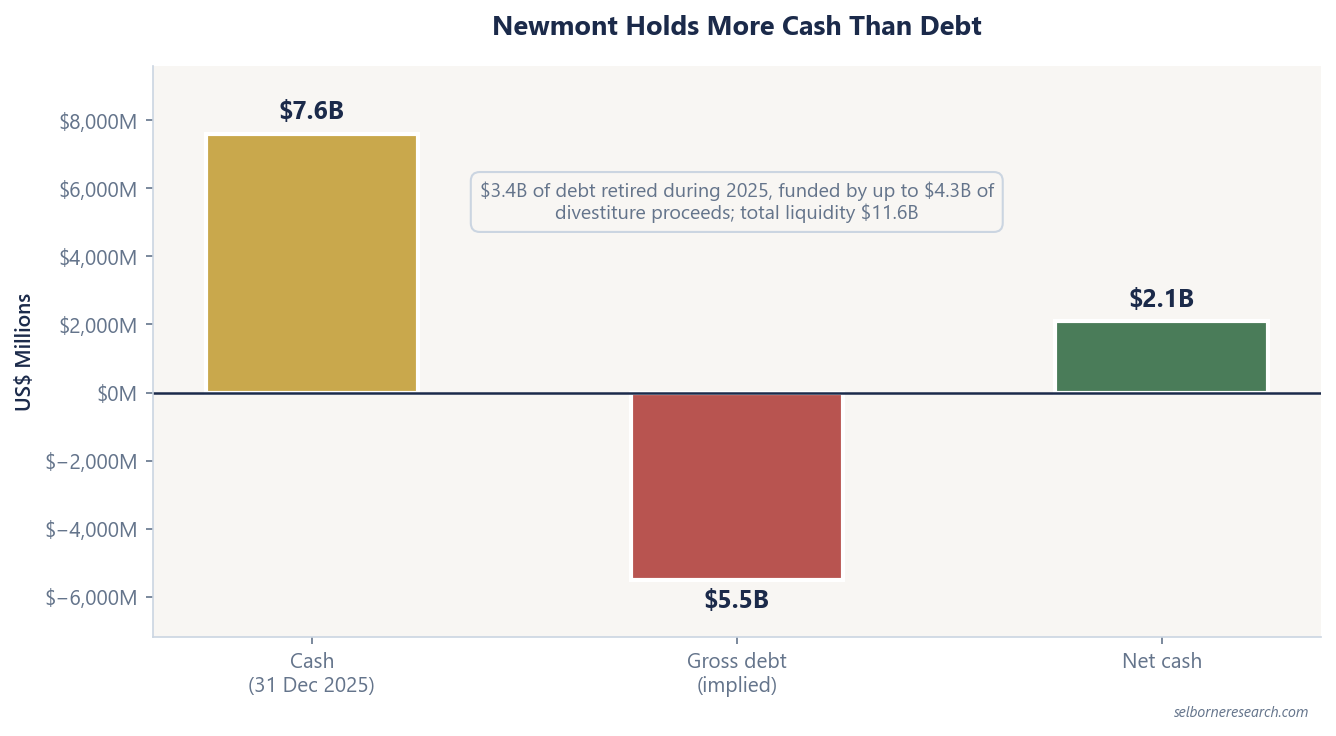
The divestiture proceeds transformed the balance sheet. Newmont retired $3.4 billion of debt in 2025, ending the year with $7.6 billion in cash and a net cash position of $2.1 billion. Total liquidity sat at $11.6 billion. For a company that took on significant debt to fund the Newcrest deal, reaching net cash within two years is a credible result.
Free cash flow hit $7.3 billion in 2025, an all-time record on $22.7 billion of revenue. Net income was $7.2 billion; adjusted EBITDA $13.5 billion. Newmont returned $3.4 billion to shareholders through dividends and buybacks, with the quarterly dividend held at $0.26 a share, $1.04 annualised and roughly a 1.1% yield. The capital allocation framework announced in February 2026 set the order of priority: sustaining capital first, then the dividend, then everything left over into buying back stock. In April 2026 the Board authorised $6.0 billion of repurchases, and by the end of June $1.7 billion of that had already been spent.
For 2026, Newmont guides to 5.26 million gold ounces (+/-5%) at an AISC of $1,680/oz (+/-5%) on a by-product basis, and reaffirmed both at the half year. The step-up in cost reflects planned mine sequencing at Ahafo South, Penasquito and Cadia, the December 2025 bushfires at Boddington, and the general grind of mining cost inflation. The offset is Ahafo North in Ghana, which declared commercial production in October 2025 and is designed for 275,000 to 325,000 ounces a year over its first five years, on a thirteen-year mine life. Those are fresh, lower-cost ounces arriving as the older Ahafo South pits work through poorer ore.
What to Watch in the Financials
Mine-level AISC trends. The headline number hides wide variation across the portfolio, and two mines drive most of it. Cadia was already guided to higher costs in 2026 on lower gold production and heavier spending on tailings capacity, then a seismic event in April 2026 stopped the block caves; production from the operating caves restarted in mid-June, but cave establishment is still on hold pending regulatory approval. Lihir carries higher costs from processing low-grade stockpiles and a long history of operational variability, driven by the pressure oxidation autoclave circuit it depends on, the largest in the world. Track those two quarter by quarter. When Cadia and Lihir move, the group average follows.
Capital deployment post-deleveraging. The debt question is settled: Newmont is in net cash and got there ahead of schedule. What matters now is where the incremental free cash flow goes, and the February 2026 framework answers that with buybacks. The $6.0 billion authorisation is being spent quickly, and management has said it will ask the Board for more as it runs down. So the thing to watch is not whether returns grow but whether they hold when gold turns; buying back stock at a record share price is a different decision from buying it back in a downturn. The worst outcome for shareholders would be another large acquisition before the Newcrest integration is fully bedded down.
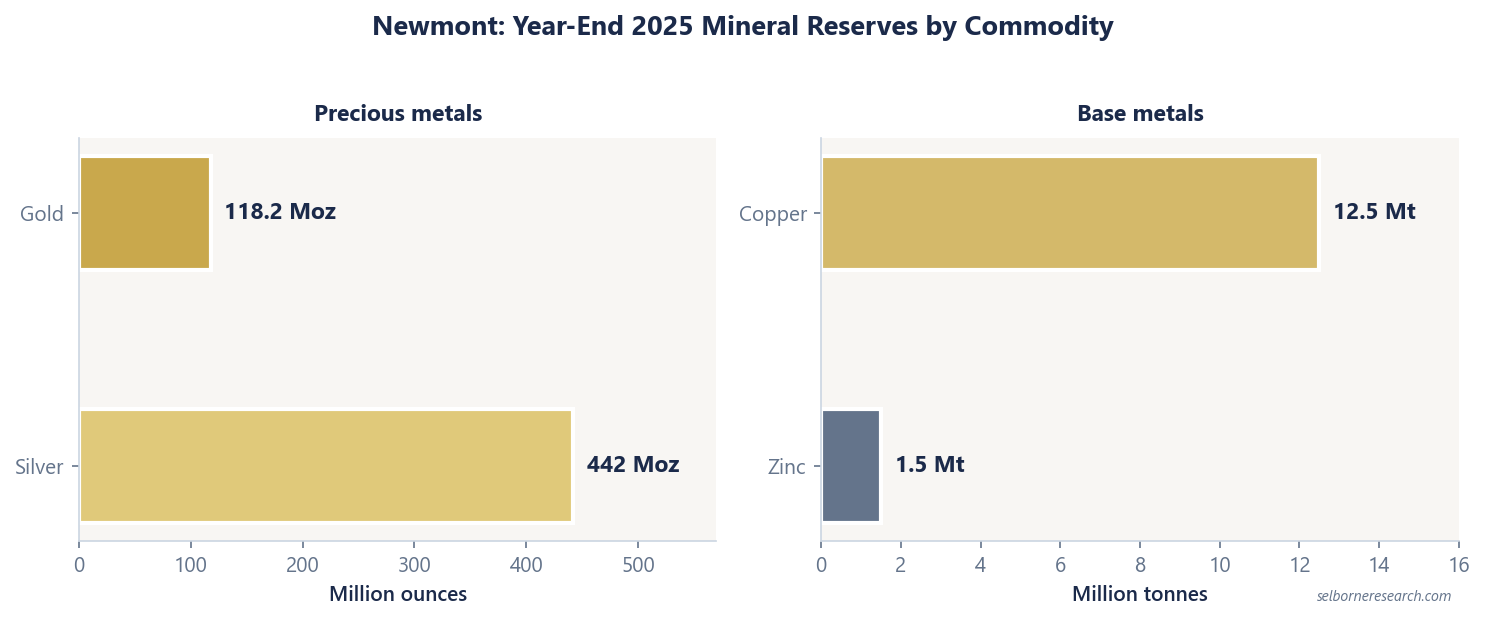
Reserve replacement. Mineral reserves fell to 118.2 million gold ounces at end-2025, down 12% from 134.1 million the prior year, with 8.6 million ounces of that walking out of the door with the divested mines rather than being mined. Measured and Indicated resources dropped 11% to 88.1 million ounces; Inferred resources fell 14% to 60.6 million ounces. At 5.26 million ounces of guided 2026 production, the reserve life runs beyond twenty years. Copper reserves of 12.5 million tonnes and silver reserves of 442 million ounces add optionality. Worth knowing: those reserves are booked at a $2,000/oz gold assumption, far under the market, so what limits them is geology and permitting rather than price. If reserve replacement lags consistently, Newmont turns from a growth story into a managed-decline story, and the market will re-rate it accordingly.
Free cash flow conversion. The $7.3 billion FCF number looks spectacular, but 2025 was a year of record gold prices. The real test is whether Newmont can sustain strong conversion at lower gold prices. Adjusted EBITDA was $13.5 billion, so FCF conversion ran at roughly 54%. Capital discipline is the other half of it. Newmont guided about $3.35 billion of total capital for 2026, $1.95 billion sustaining and $1.4 billion development, and that is a step up on the year before. Any blow-out on sustaining capital at the major mines comes straight out of free cash flow.
Peer Context
Newmont produced 5.89 million gold ounces in 2025. Barrick Mining produced 3.26 million. Agnico Eagle produced 3.45 million. In terms of scale, Newmont is in a class of its own among pure gold miners.
Cost positioning tells a different story, and it is worth being careful about which cost you compare. Agnico Eagle came in at $1,339/oz for 2025, the lowest of the three, though only just below Newmont's $1,358/oz by-product figure. Barrick reported $1,637/oz. That gap looks enormous against Newmont's by-product number and much smaller against Newmont's $1,609/oz co-product number, and the co-product comparison is the fairer one, because Barrick reports its copper as a separate business rather than crediting it back against the cost of gold. Whatever residual advantage Newmont holds over Barrick came partly from selling its higher-cost ounces and partly from Barrick's own difficulties at Nevada Gold Mines and Pueblo Viejo.
On valuation, use two lenses. EV per reserve ounce tracks the gold price, so compare it across peers rather than to a fixed dollar level. Newmont screens at ~$874/oz, above Barrick (~$751/oz), with Agnico higher still on a smaller, higher-quality reserve base. Price-to-NAV is the second screen: senior producers usually trade between 0.8x and 1.1x NAV, and where a senior sits within that range tracks its cost position, how much of its portfolio is in Tier-1 ground, and execution consistency. A lower AISC and a Tier-1-weighted footprint (Canada, Australia, Finland) sit at the stronger end of those drivers; a wider jurisdiction spread and joint-venture complexity sit at the weaker end.
Newmont has the industry's largest reserve base, 118 million ounces against Barrick's 85 million and Agnico's 55 million, and the most diversified production footprint, plus copper and silver optionality. The trade-off is cost efficiency and operational simplicity. Managing mines across Australia, North America, South America, West Africa, and PNG is inherently more complex than running a focused North American or Australian portfolio. That complexity tends to show up in a lower relative multiple versus more concentrated peers.
Key Risks
Gold price sensitivity. At 2026 guided AISC of $1,680/oz and gold near $4,500, Newmont's margins are the widest in its history, and the arithmetic of a retreat is brutally simple. At $2,500/oz gold the AISC margin is about $820 an ounce; at $2,000/oz it is about $320. The second of those is close to nothing at the corporate level, because AISC deliberately leaves out development capital and tax. Newmont's $1.4 billion of 2026 development spending is roughly $270 an ounce on its own, before a dollar of tax. That is the trap in reading AISC as a break-even price: it is a cost measure for a producing mine, not the price at which the company stops losing money. Current gold makes all this feel academic, but mining shares get priced on through-cycle economics rather than spot, and the earnings leverage that works so well now works just as hard in reverse.
Lihir operational risk. Lihir is Newmont's most operationally complex mine. The orebody is refractory, requiring pressure oxidation through the world's largest autoclave circuit. The mine sits on a geothermally active island in Papua New Guinea, with limited infrastructure and a history of weather-related disruptions. Production in recent years has been variable, with lower-grade ore feeding higher unit costs. Lihir's AISC is expected to rise further in 2026 due to stockpile processing costs. A major autoclave failure or extended downtime at Lihir would take several hundred thousand ounces offline and push group AISC materially higher.
Divestiture execution tail. The hard part is done. All six operations were sold by April 2025, and the shares Newmont took as part-payment have largely been turned into cash: the Discovery Silver stake went in full during 2025, and half the Greatland holding with it, both at large gains on the values booked at the time of the deals. What is left of the headline $4.3 billion is the contingent slice, payments and earn-outs that only arrive if the buyers hit production or price triggers. Treat the headline as a ceiling, not a receipt.
Jurisdictional and political risk. Ghana, Suriname, and PNG together account for a meaningful share of production, and the fiscal terms are not fixed. Ghana tripled its Growth and Sustainability Levy on mining companies in 2025, from 1% to 3% of gross production, which is charged on revenue and so lands whatever the mine's costs are doing. PNG carries persistent political instability and a history of resource nationalism. Suriname is a newer jurisdiction for large-scale mining with regulatory frameworks still forming. Australia and Canada are stable, but the emerging-market tail is real, and a fiscal change of Ghana's kind hits a NAV faster than an operating stumble does.
Integration drag on margins. Newmont hit the $500 million synergy target, but integration is not just about cost savings. Bringing two workforces together takes years. Leadership changed hands in the middle of it: Tom Palmer retired at the end of 2025 after twelve years at the company and Natascha Viljoen, previously president and chief operating officer, became chief executive on 1 January 2026. Hidden costs linger past the headline savings: stranded overhead at divested sites, IT migrations, and disruption while mine teams adjust to new reporting standards. The synergies are real, but so is the drag. If AISC at the ex-Newcrest mines keeps missing guidance for reasons nobody can point at, integration friction is usually the answer.
Reserve depletion without replacement. Selling mines explains most of last year's reserve decline, but it does not solve the underlying problem. Newmont has to find or convert roughly 5 million ounces every year simply to stand still, and the resource categories that feed reserves both shrank in 2025. Given the scarcity of Tier 1 greenfield discoveries globally and the capital intensity of mine development, the risk is that Newmont slowly depletes its reserve base without finding enough to replace it. A NAV model that assumes static reserves will overstate long-term value if replacement falters.
One Newmont share buys a portfolio of mines with little in common. The primer builds the NAV mine by mine.
The Excel model is the primer's two NAVs live across 12 sheets: change the gold price, ramp or discount rate and the valuation moves.