Agnico Eagle Mines (AEM)
Agnico Eagle research profile covering its Canadian-weighted gold portfolio, costs, reserves, growth pipeline and mining valuation.
Educational analysis for professional use. This profile is not investment advice or a recommendation to buy or sell any security, and it is not personalised.
Snapshot
The Jurisdiction Advantage
Agnico Eagle reports AISC of $1,339/oz from a portfolio that sits almost entirely in Canada, Australia and Finland. The exception is small and worth naming: Pinos Altos in Mexico produced 81,734 ounces in 2025, a little over 2% of the group, and Agnico is also half-owner of the San Nicolás copper-zinc project in Zacatecas alongside Teck. So the jurisdiction story is near-absolute rather than absolute.
Compare that to Barrick, which draws about a quarter of its gold from Africa and the Middle East. Mali showed in 2025 what that can mean: the state ran Loulo-Gounkoto under provisional administration for most of the year and Barrick's group output fell. Or Newmont, with Peru and Argentina in the mix. Agnico's ground is duller, and duller is the point: permits still take years in Nunavut, but the fiscal terms agreed at the start are the terms that apply at the end. The trade-off is cost. Canadian and Australian labour is expensive, and the northern mines run on seasonal resupply. Jurisdiction quality buys a narrower range of outcomes, not a lower cost base.
Cost Structure and Margins
Full-year 2025 AISC came in at $1,339/oz on payable production of 3.45 million ounces, the ounces Agnico actually sells after refining losses. Total cash costs were $979/oz. The company guides 2026 AISC at $1,400–$1,550/oz, and the step-up is worth understanding, because most of it is not cost inflation. Agnico's royalties are levied on revenue, so a record gold price mechanically raises AISC even when nothing at the mine has changed. Higher sustaining capital at Odyssey and Detour Lake does the rest.
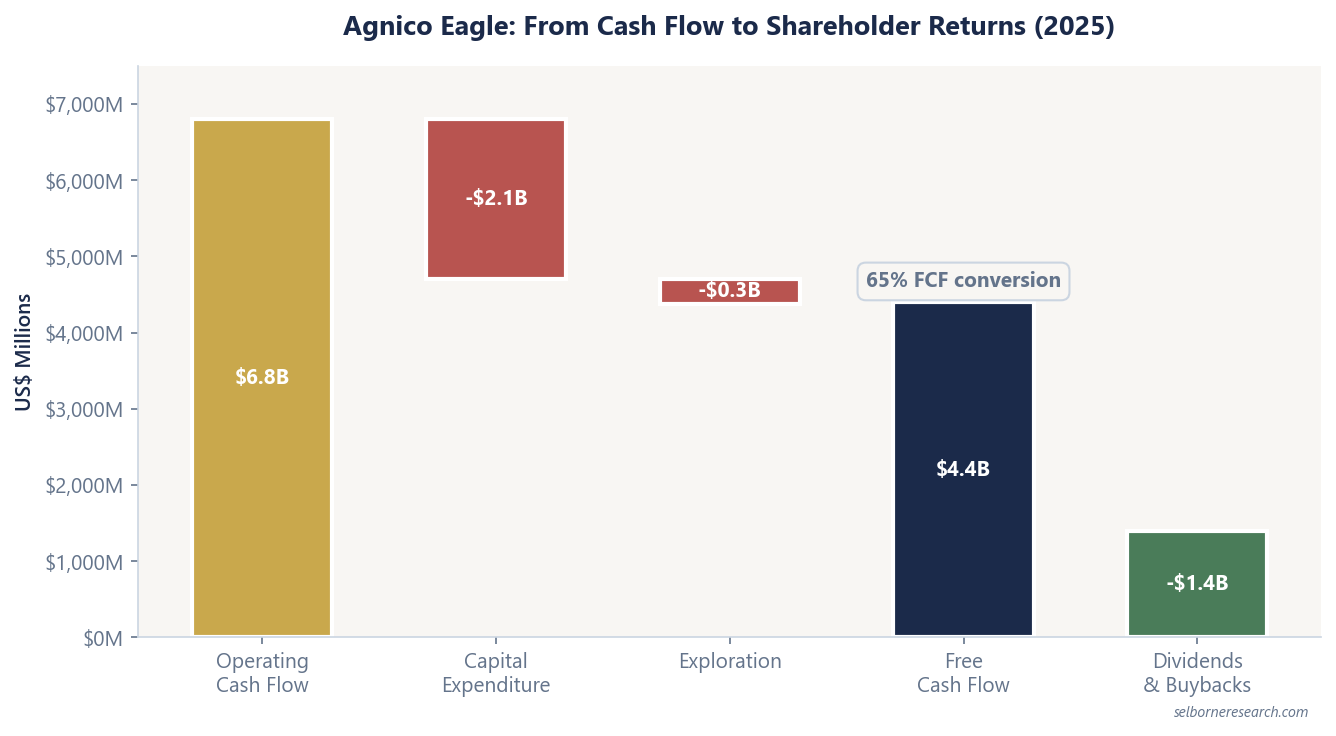
Free cash flow reached a record $4.4 billion in 2025 on $6.8 billion of operating cash flow. That funded the growth programme, returned $1.4 billion to shareholders through dividends (raised 12.5%) and buybacks, and still left the company in net cash: $2.67 billion at year-end, against net debt of $217 million a year earlier.
The leverage to gold is direct. Every $100/oz on the realised price is about $345 million of revenue on 3.45 million ounces, of which roughly $220 million reaches free cash flow once royalties and a mid-30s tax rate are taken out. That single number does most of the work in any scenario you run on this company.
What to Watch in the Financials
If you're building a model on Agnico, four line items matter most.
Costs mine by mine, not blended. The $979/oz group cash cost is an average of a wide spread. Fosterville in Victoria ran at $937/oz in 2025 on 160,522 ounces; Pinos Altos in Mexico ran at $2,006/oz on 81,734 ounces. Detour Lake, the volume anchor at 692,675 ounces, is what pulls the average down. A blended figure tells you almost nothing about which mine is under strain, so read the per-mine table and watch the ones moving into underground production.
Reserve replacement. Proven and probable reserves grew 2.1% to 55.4 million ounces in 2025. Resources rose too: measured and indicated up 9.6% to 47.1 million ounces, inferred up 15.5% to 41.8 million ounces. Reserves are the ounces backed by a mine plan and economics; resources are ounces the geology supports but the plan does not yet count, with inferred the loosest of the three. Growing all three off the drill bit rather than an acquisition is rare among the seniors.
Exploration and development spend. Agnico spent $318 million on capitalised exploration in 2025 and guides $290–$330 million for 2026. Capital expenditure guidance for 2026 was raised to $2.6–$2.8 billion from $2.2–$2.4 billion after the board approved construction at Hope Bay in May 2026. Detour Lake underground takes about $130 million of the 2026 spend, Odyssey a good deal more. These are multi-year commitments, so they compress free cash flow whatever gold does.
FCF conversion. Free cash flow was 65% of operating cash flow in 2025. Hope Bay, Odyssey and Detour will all draw on the same pot from here, so the ratio is the cleanest way to see how much of the gold windfall reaches shareholders rather than the ground. If it falls towards 50%, the growth-versus-returns argument gets loud.
Reserve Life and the Growth Pipeline
At 55.4 million ounces of reserves (1.30 g/t) and 3.45 million ounces of annual production, reserve life sits at roughly 16 years. That ratio is the crudest possible measure and it flatters a company whose ounces are spread across a dozen mines with different lives, but the direction of travel matters: reserves have grown year-on-year despite depletion. Anyone building a mine-by-mine NAV is really testing whether that keeps happening.
Odyssey, the underground mine replacing the Canadian Malartic open pit, matters most of the four, because it is replacing production the company already has rather than adding to it. It hosts 6.0 million ounces of proven and probable reserves plus 12.7 million ounces of inferred resource, and the 2023 plan has it producing about 8.5 million ounces through 2042. Going underground is operationally heavy: costs per tonne rise, development capital comes first and revenue later. The first phase of shaft sinking finished in July 2026 at 1,586 metres, with shaft hoisting from the East Gouldie zone due to start in the second quarter of 2027, so the hardest part of the build is behind it.
Hope Bay in Nunavut is the newest. Agnico approved construction in May 2026 on roughly $2.4 billion of initial capital for an underground mine producing 400,000 to 435,000 ounces a year from 2030, and that decision is what lifted 2026 capital guidance by $400 million. The study used a $3,600/oz gold price and returned a 19% after-tax IRR, which is a respectable but not spectacular return for an Arctic build, and it is the single clearest signal of how Agnico intends to spend the gold-price windfall.
Detour Lake underground is the third, and it is not yet approved. The company has committed $300 million ($100 million in 2024, $200 million more in 2025) to reach a go/no-go decision in mid-2027, with roughly $130 million of that falling in 2026. The exploration ramp had advanced 569 metres in length by the end of 2025. If the underground grade converts, Detour's life extends well beyond the pit plan; if it does not, that $300 million bought information rather than a mine.
The fourth is Finland. In April 2026 Agnico bought Rupert Resources and Aurion Resources and took out B2Gold's 70% share of their Finnish joint venture, consolidating the ground around the Kittilä mine including the Ikkari deposit. It is exploration ground rather than production, so nothing shows up in guidance for years, but it is a large bet placed at a gold-price high.
Peer Context
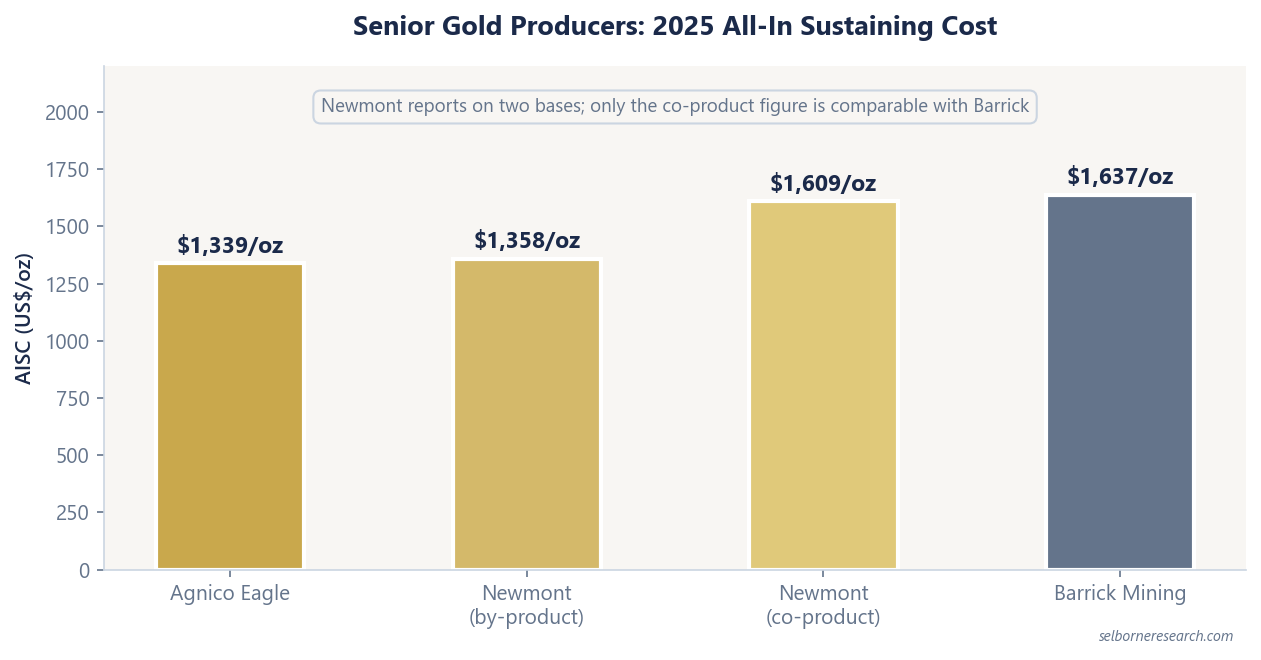
Among the senior gold producers, Agnico occupies a distinct lane. Barrick reported 2025 AISC of $1,637/oz on 3.26 million ounces, roughly $300 dearer than Agnico on slightly less gold, and with the political exposure described above. Newmont looks closer at $1,358/oz on 5.89 million ounces, but that is its by-product figure, struck after crediting copper and silver sales against gold's cost. On a co-product basis, which splits costs across the metals instead, Newmont's 2025 AISC was $1,609/oz. Agnico produces almost nothing but gold, so its number needs no such adjustment, and the like-for-like gap is far wider than the headline suggests. Never compare a by-product AISC with a co-product one.
The catch is commodity concentration. Barrick has copper, Newmont copper and silver, Agnico effectively only gold. In a gold bull market that purity is a feature; in a downturn there is nothing to lean on, and San Nicolás is years from changing it. Seniors are screened on price to net asset value, the market's price against a discounted valuation of the mines, where 0.8-1.1x is roughly the fair range for a senior. A first-quartile cost base, an FCF yield near 4.9% on FY2025 cash flow and jurisdictions that do not surprise you are the qualities the market rewards within that range; a single metal and a heavy build programme are the offsets against them. For more on how these metrics compare, see the AISC guide.
Key Risks
Execution at Canadian Malartic is the risk that matters most, because the complex carries most of Agnico's reserve life beyond 2035. Deep underground projects in Canada have a long record of cost inflation and schedule slippage. The open pit has already given a reminder: a rock mass movement at the Barnat pit in July 2026 forced a redesign, and 2026 production is now expected near the bottom of the 3.3 to 3.5 million ounce range rather than the middle of it.
Detour Lake underground carries the same risk on a smaller scale, and unapproved. The $300 million spent so far buys a decision, not a mine. An approval that slips past mid-2027, or arrives with a much larger capital number attached, would thin the production profile in the 2030s.
Gold exposure is unhedged, and the arithmetic above cuts both ways. Agnico realised about $3,450/oz in 2025. A 30% fall from there is roughly $1,050/oz, which on 3.45 million ounces strips about $3.6 billion of revenue and, at the $220 million per $100/oz above, roughly $2.3 billion of the $4.4 billion of free cash flow. Over half, in other words. Note what that does not mean. AISC of $1,339/oz is a cost, not a break-even: it excludes Hope Bay's construction capital and it excludes tax, so the mines keep making cash long after the growth programme stops paying for itself. The dividend and the buyback are what give way first.
Currency is the quieter risk. Gold sells in US dollars while most of Agnico's costs are incurred in Canadian dollars, so a stronger Canadian dollar raises reported costs without changing an ounce of production. A weak Canadian dollar has been a quiet part of the cost advantage for years, and it is not a permanent one.
Agnico sits in the lowest-cost quartile of gold miners. The primer shows what that buys on the P/NAV bands.
The Excel model is the primer's two NAVs live across 12 sheets: change the gold price, ramp or discount rate and the valuation moves.