Barrick Mining (B)
Barrick Mining research profile covering its gold and copper portfolio, reserves, cost structure, growth projects and mining valuation framework.
Educational analysis for professional use. This profile is not investment advice or a recommendation to buy or sell any security, and it is not personalised.
Snapshot
Business Overview
The geography that carries Barrick's risk is not the geography that carries its cost. Africa is where a government can take a mine off you, and in 2025 one did; Nevada is where the ounces are dearest to pull out of the ground. Value the company on one of those facts and you will get the other one wrong. In 2025 the group produced 3.26 million ounces of gold and 220,000 tonnes of copper, generating $3.87 billion in free cash flow on $16.96 billion of revenue. Gold AISC came in at $1,637/oz (total cash cost $1,199/oz); copper ran at $2.14/lb C1 with copper AISC of $3.20/lb.
Nevada Gold Mines: The Anchor
Start here. Nevada Gold Mines (NGM) is a joint venture: Barrick owns 61.5%, Newmont owns 38.5%, and Barrick operates it. The JV controls mines and processing facilities across northern Nevada (Carlin, Cortez, Turquoise Ridge, and others). Nevada is where the ounces are, and it is also the dearest place Barrick mines them. On the filed 2025 segment numbers, North America produced 2,093koz at an AISC of $1,601/oz, against 840koz from Africa and the Middle East at $1,543/oz and 322koz from South America and Asia Pacific at $1,502/oz. Nevada and Pueblo Viejo sit inside that North American segment, so two-thirds of Barrick's gold comes out of its dearest region.
Every one of those regional numbers sits below the group's $1,637/oz, which looks impossible until you know why: corporate administration, exploration and other central costs are carried at group level rather than pushed out to a region. So the segment figures tell you which rocks cost more to mine, and the group figure tells you what the whole company costs to run.

The accounting matters. Barrick books 61.5% of NGM's output as attributable production, not the full amount. When capital goes into Nevada, it flows through the JV structure, and attributable costs reflect only Barrick's ownership share. If you're building a DCF model, use attributable ounces and attributable AISC, not the JV's consolidated figures.
Beyond Nevada
Pueblo Viejo in the Dominican Republic (60% Barrick, 40% Newmont) is high-grade and long-lived. In Africa, Barrick runs Loulo-Gounkoto in Mali (80% owned), Bulyanhulu and North Mara in Tanzania, and Kibali in the DRC (45% owned, Barrick operating). These mines generate meaningful cash, but they carry jurisdictional risk of a kind Nevada does not.
Mali is the case study, and it is worth knowing in detail because it shows what the risk actually looks like when it arrives. It was not a tax bill. Mali detained Barrick employees, seized gold from the site, and ran Loulo-Gounkoto under a state-appointed administrator, with production suspended for most of 2025. Barrick settled in November 2025 for roughly $430 million, accepted Mali's 2023 mining code, and got operational control back in mid-December. That single mine going dark is most of the reason group production fell about 17% in 2025, from 3.91 million ounces to 3.26 million. A discount rate is the wrong tool for this: the loss was not a lower cash flow, it was no cash flow at all for the best part of a year.
Then there's copper. Barrick holds the Lumwana mine in Zambia and a 50% stake in Reko Diq in Pakistan, with the Pakistani federal and Balochistan governments holding the rest. Attributable copper reserves jumped 224% in 2024 after feasibility studies on both, from 5.6 million tonnes to 18 million. Both have moved into execution: Lumwana's Super Pit expansion targets around 240,000 tonnes of copper a year from first production in 2028, and Reko Diq targets 2028 too. Neither contributes today, and neither is small enough to be treated as a rounding error tomorrow. The May 2025 name change to Barrick Mining Corporation, and the ticker change from GOLD to B, was partly a signal that copper is no longer a side story.
The NewCo Spin-Off
In December 2025 Barrick said it was evaluating an IPO of its North American gold assets into a separate entity provisionally called "NewCo," valued at around $42 billion, and in February 2026 the board authorised preparations, targeting a listing by the end of 2026. NewCo would house Barrick's NGM stake, Pueblo Viejo, and the wholly owned Fourmile discovery in Nevada. Only a small minority of it would be sold; Barrick intends to keep control. If it goes ahead, what is left in Barrick is a predominantly African and copper-focused miner, a very different risk profile. Newmont's dispute over the Nevada JV, covered below, is the live obstacle.
How the Economics Work
JV Structure and Attributable Production
The accounting trap that catches analysts: every NGM figure Barrick reports is its 61.5% share, not the mine's total. A headline that NGM produced X million ounces means Barrick booked 0.615 times that, and its attributable AISC likewise reflects only its pro-rata share of sustaining capital, royalties and operating costs. Compare an attributable figure against a consolidated one and the model breaks. This is standard for JV mining, but Barrick's single most important asset is a JV, so the mistake costs more here than almost anywhere.
Gold Mining Margins at Current Prices
Barrick realised $3,501/oz on its gold in 2025 against AISC of $1,637/oz, so roughly $1,860 of margin on every ounce sold. That is what funded $3.87 billion of free cash flow, nearly triple 2024's. Costs are rising, though: 2026 AISC guidance is $1,760–$1,950/oz. Part of that step up is mechanical rather than operational, because government royalties are struck as a share of the gold price, so a higher gold price raises AISC by itself.
The useful way to stress this is to hold AISC at the 2026 guidance midpoint of about $1,855/oz and walk the gold price down. At $3,000/oz there is still around $1,145 of margin an ounce. At $2,500/oz it is roughly $645, thin enough that sustaining the dividend and funding Lumwana and Reko Diq at the same time stops being comfortable. The squeeze lands first in Nevada, on the filed 2025 costs, which is not where most people would look for it.
Fourmile: The Exploration Upside
Fourmile is a wholly owned discovery next to the Cortez complex in Nevada, and it sits outside the Nevada JV, which is why Newmont cares about it. Barrick doubled the resource in 2025, to 2.6 million indicated ounces and 13 million inferred ounces at grades around 17 g/t. That is roughly seventeen times the grade of the group's 0.98 g/t reserve book. The two categories are not equivalent: indicated means drilled densely enough to plan a mine around, inferred is a geologist's estimate between drill holes and routinely shrinks when it is tested. Nothing here is a reserve yet, and Fourmile generates no cash today.
What to Watch in the Financials
Four line items deserve your attention every quarter.
Segment AISC, not group AISC. The group number averages away the thing you want to see. Barrick reports cost by region, so read those: North America is two-thirds of production and therefore sets the group's direction, and a widening spread between the cheapest and dearest regions is what portfolio risk looks like before it reaches the headline.
Reserve replacement, and why the grade fell. Barrick's reserve grade dropped from 1.65 g/t at the end of 2023 to 0.98 g/t at the end of 2025, and it is easy to read that as mines ageing into poorer rock. It is not. In 2024 Barrick converted Reko Diq's gold to reserves, 13 million ounces at 0.28 g/t, and adding that much very low-grade material to a 77-million-ounce book at 1.65 g/t drags the average down on arithmetic alone. Strip Reko Diq out and Barrick replaced its 2024 depletion at a 4% higher grade. The same event explains the flattering three-year rolling replacement figure of about 190%: it is one project conversion, not a repeatable exploration run rate.
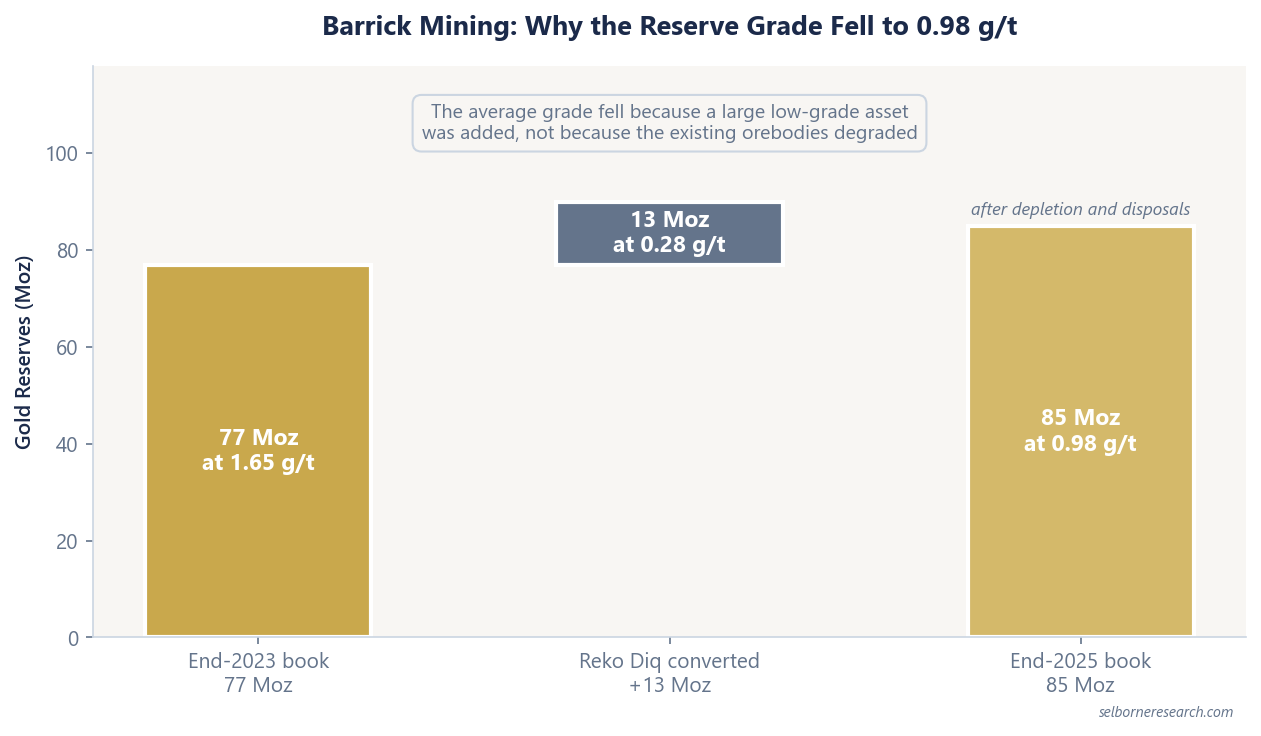
The number to watch is the ordinary one. In 2025 Barrick added 1.8 million ounces of reserves against 3.7 million ounces depleted, and the book fell from 89 to 85 million ounces, the balance being the sale of Hemlo and Tongon. Replacing half of what you mine is fine for a year and a problem as a trend, because reserve life is what a long-dated NAV is built on.
Net debt trajectory. Barrick ended 2025 in a net cash position: $6.71 billion in cash versus roughly $4.7 billion of debt. Strong. But Lumwana, Reko Diq, and Fourmile all need capital. If copper prices fall or the NewCo IPO stalls, development spending could push the balance sheet back toward net debt. Watch capital guidance closely.
Free cash flow conversion. Barrick generated $3.87 billion in FCF in 2025 on $7.69 billion of operating cash flow. The new dividend policy targets 50% of attributable FCF as total payout: a $0.175/quarter base dividend plus a performance top-up. In Q4 2025, the quarterly dividend hit $0.42/share, up 140% from Q3. That's generous at current gold prices, but the payout is directly tied to FCF, which is directly tied to gold prices. No gold price floor, no dividend floor.
Peer Context
Among senior gold producers, Barrick's 2025 AISC of $1,637/oz compares to Newmont's $1,358/oz (by-product basis) and Agnico Eagle's $1,339/oz on 3.45 million ounces from Canada, Australia and Finland. Newmont produced 5.89 million ounces. Barrick is the dearest of the three, but it is not a high-cost miner in absolute terms: on the industry cost curve, $1,637/oz sits in the second quartile, below the roughly $1,709/oz industry median.
The gap does not trace to Africa. Two-thirds of Barrick's ounces come from North America, so North America sets the group's cost level, and in 2025 it ran $58/oz dearer than Africa and the Middle East. Whatever explains Barrick's gap to Newmont and Agnico, it is not the African mines.
In a sustained rally, Barrick's scale (3.26 Moz in 2025) and 85-million-ounce reserve base (0.98 g/t, roughly 26-year reserve life) throw off more absolute cash than most peers. On P/NAV bands of 0.8-1.1x for fair-value seniors, Barrick's ~$751/oz EV per reserve ounce reflects that reserve depth, while its jurisdictional mix is the factor that weighs on where in the band it sits.
Valuation Framework
Large-cap gold miners trade on NAV multiples. The standard approach is sum-of-the-parts: build a DCF for each mine, apply discount rates adjusted for jurisdiction (a Tier-1 rate for Nevada, materially higher for Mali or the DRC), sum them, subtract net debt, add exploration upside, and divide by diluted shares.
Reserves in a stable jurisdiction, with long life and cost headroom, trade at higher per-ounce values than the same ounces somewhere a government can take them. That is the whole argument for splitting the rate by country rather than valuing Barrick on one blended WACC. The ~$751/oz EV per reserve ounce is a screen, not a valuation: it says nothing about which ounces are cheap to mine or which are safe, and on this portfolio those are different questions.
How to Frame the Business
Barrick is a levered play on gold duration: 85 million ounces of reserves and roughly a 26-year mine life. Nevada and Pueblo Viejo supply the scale and the safety of jurisdiction, though not the cheapest ounces. Africa supplies cheaper ounces and the risk that they stop.
The 50% FCF payout policy provides visibility on shareholder returns. In 2025 that meant $3.87 billion of free cash flow, $1.5 billion of buybacks and a Q4 dividend of $0.42. Copper via Lumwana and Reko Diq is genuine upside if those projects reach production in 2028, but it earns nothing before then. The NewCo listing, if completed, would create a focused North American gold vehicle that could trade above Barrick's blended multiple, but only if the Newmont dispute clears and the IPO window cooperates.
Key Risks
Jurisdictional and Political Risk
Jurisdiction is Barrick's largest risk bucket, and Mali showed the shape of it: a mine taken out of the company's hands for the better part of a year, with staff detained and gold seized. Barrick also operates in Tanzania, the DRC, Papua New Guinea and, once Reko Diq is built, Pakistan. The DRC has a history of mining code revisions and windfall taxes; Papua New Guinea periodically renegotiates mining agreements; Pakistan carries federal-provincial tension over resource revenue. Africa and the Middle East were 840koz of the 3.26 million ounces produced in 2025, about a quarter, and Loulo-Gounkoto was barely running for most of it. Size the exposure on a normal year, not on 2025.
Nevada Gold Mines JV Dispute
In February 2026, Newmont issued a formal notice of default against Barrick, alleging that Barrick diverted NGM equipment, staff and technical resources to accelerate development of the wholly owned Fourmile project. Newmont's case is that shared JV assets are being used to build up a project it has no stake in, and which would go into NewCo. Barrick denies it. The JV agreement gave Barrick 30 days to remedy; that window passed in March 2026 without a settlement, and Newmont has said it will oppose any listing of the North American assets while the default stands. Barrick's largest single asset is therefore mid-argument with the partner who owns 38.5% of it. That belongs on the quarterly catalyst list beside AISC and the IPO timetable, not in the monitor-occasionally pile.
Cost Inflation
Barrick's 2026 AISC guidance of $1,760–$1,950/oz is materially higher than 2025's $1,637/oz. Some of that is arithmetic rather than deterioration, since royalties are priced off the gold price and rise with it. The rest is labour, energy and sustaining capital, which do not fall back when gold does. That is the asymmetry to hold on to: a cost base geared to a high gold price does not un-gear itself quickly at a low one. Note what the guidance figure is: a cost per ounce, not a break-even gold price. It excludes tax, interest and the capital going into Lumwana, Reko Diq and Fourmile, so the price Barrick actually needs to fund itself is higher than the AISC number, not equal to it.
Commodity Price Sensitivity
Because the payout is set at 50% of free cash flow, the dividend moves with gold rather than smoothing it, and the only floor is the $0.175 quarterly base. On the 2026 cost guidance, a fall to $2,500/oz takes the margin per ounce to roughly a third of 2025's $1,864, which is where paying shareholders and building two copper mines start competing for the same cash. The copper is no help: it is pre-production, so it hedges nothing in a gold downturn. And Barrick enters any downturn about $300/oz behind Agnico Eagle on cost, though only about $30/oz behind Newmont once Newmont's copper and silver credits are taken back out.
NewCo Execution Risk
The planned IPO of North American assets is ambitious. If completed, it creates two distinct entities with different risk profiles. But the Newmont dispute could block or delay the deal, since NGM (a JV asset) is central to NewCo. Market conditions, regulatory approvals, and the resolution of the default notice all need to go right. If the IPO fails or is indefinitely postponed, Barrick remains a blended portfolio (fine in itself), but the re-rating catalyst disappears.
Barrick's ounces come from countries an analyst would never discount at the same rate. The primer sets a rate per mine.
The Excel model is the primer's two NAVs live across 12 sheets: change the gold price, ramp or discount rate and the valuation moves.