Iron Ore Cost Curve: C1 Cash Costs of the Majors
The big-four iron ore C1 cost curve compared: BHP, Fortescue, Vale and Rio Tinto, why the definitions differ, and the gap from C1 to the all-in cost.
Educational analysis for professional use. This guide is not investment advice or a recommendation to buy or sell any security, and it is not personalised.
In Iron Ore, the Cost Curve Is the Equity Story
Iron ore producers all sell essentially the same product into the same Chinese-dominated seaborne market, priced off the same Platts index. None has pricing power or a product moat worth naming. What separates a great iron ore equity from a mediocre one is position on the cost curve, multiplied by volume.
The seaborne price settles where the marginal tonne, high-cost Chinese domestic ore or junior seaborne supply, just breaks even. The majors’ direct mining costs run $17-24/t before freight, royalties and capital, against a price that has averaged $123/t over the past five years (IMF series, 2021-2025). That distance between a major’s own cost and the marginal producer’s is the earnings engine, and it survives the cycle in a way steelmaker spreads do not.
That makes the C1 cost curve the first table in any iron ore model. It is also one of the easiest tables to get wrong, because the four majors define C1 four different ways.
The Big-4 Disclosed C1 Curve
Here is the curve as the companies actually disclose it, latest reported periods:
| Producer | Disclosed C1 | Period | Definition footnote |
|---|---|---|---|
| BHP (WAIO) | $17.29/t | FY to 30 Jun 2025 | Excludes royalties and freight; total unit cost $18.56/t |
| Fortescue (hematite) | $17.99/wmt | FY to 30 Jun 2025 | Wet metric tonnes; excludes Iron Bridge magnetite |
| Vale (fines) | $21.3/t | CY2025 | Excludes third-party ore purchases |
| Rio Tinto (Pilbara) | $23.5/wmt | FY2025 | Wet metric tonnes, FOB basis |
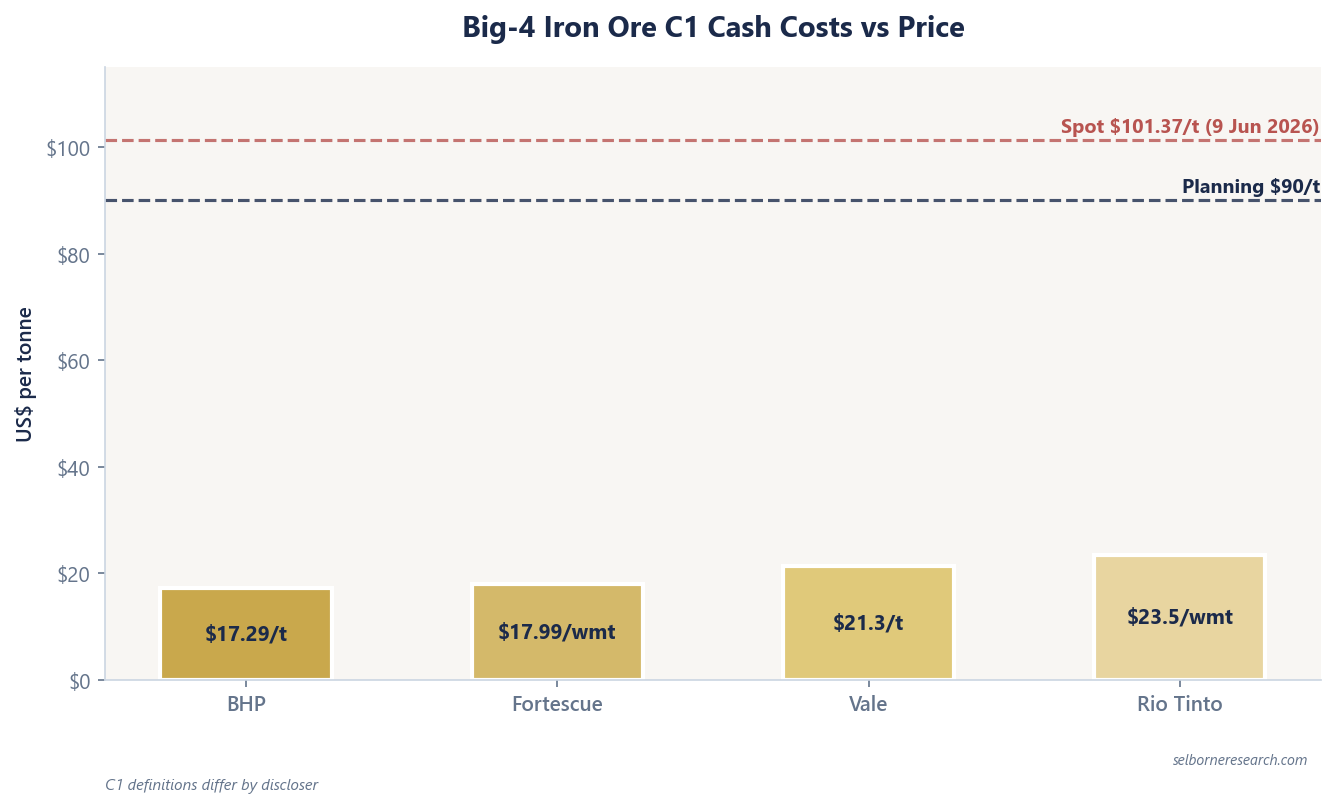
Never present these as one bare column of numbers. The definitions differ enough to reorder the curve:
- Rio and Fortescue report per wet metric tonne. Moisture sits in the denominator, so a wet-basis cost looks lower per tonne than the same operation measured dry. Comparing Rio’s $23.5/wmt against Vale’s $21.3/t without flagging this is an apples-to-pears error.
- Exclusions differ by company. BHP’s C1 strips out royalties and freight (its total unit cost is $18.56/t). Vale’s excludes ore bought from third parties; Fortescue’s covers hematite only, leaving out the higher-cost Iron Bridge magnetite operation.
- BHP and Fortescue run June financial years; Vale and Rio report calendar years, so the FY2025 and CY2025 figures above cover different twelve-month windows.
The discipline is the same one gold analysts apply to AISC versus cash cost: the headline cost number is a starting point, and the footnote telling you what it includes is where the comparison actually lives. A cross-miner cost table without a definitions column is a table you can’t trust.
From C1 to the All-In Cost
C1 is well under half of what a tonne really costs, and how far under depends mostly on how far the ore has to sail. Vale gives the cleanest disclosure of the full picture: C1 of $21.3/t for CY2025 against an all-in cost of $54.2/t, so C1 is under 40% of the total. The $33/t between them is freight to China, government royalties, sustaining capital and corporate costs. Freight is the biggest single piece, and it is Brazil’s structural disadvantage against the Pilbara: the voyage to China is roughly three times the distance. So don’t take Vale’s ratio and apply it to an Australian producer, whose gap between C1 and all-in is narrower.
Vale is the only one of the four that publishes a named all-in figure; for the others you have to assemble the equivalent yourself from the freight, royalty and capex disclosures. That assembly matters because the all-in number, not C1, is what your long-term price assumption has to clear. A producer quoting $18/t C1 isn’t generating free cash at a $30/t iron ore price, however good the headline looks.
The Grade Discount: The Curve’s Other Axis
A low C1 can be partly given back on the revenue line. Fortescue mines lower-grade ore, and lower-Fe ore prices below the 62% Fe benchmark. In the quarter to December 2025 (its Q2 FY2026), Fortescue realised $92.88/dmt against a Platts 62% Fe index average of $105.99/dmt, a realisation of 88%. Across the half it was 87%.
So Fortescue’s near-bottom C1 of $17.99/wmt overstates its margin advantage: it gives back around 12% of the benchmark price through grade before costs enter the picture. And the discount isn’t stable. It widens when Chinese mill margins are fat, because a mill earning well is limited by furnace capacity rather than by ore cost, so it pays up for iron content to push more steel through the same blast furnace. When margins are thin, mills buy the cheapest units they can and the discount narrows. Fortescue realised around 65% of the benchmark in FY2018, when Chinese mill margins were at their strongest in a decade, against the mid-to-high 80s through the thin-margin years since. So the discount moves against Fortescue exactly when Chinese steel is running hottest, and gives some of it back when steel is struggling.
Don’t rank producers on C1 alone. Build a margin curve, realised price minus all-in cost, and rank on that. The C1 curve and the realisation table are the two inputs; neither works without the other.
What the Curve Earns at Planning Prices
Our iron ore planning price is $90/t (62% Fe CFR China basis). Context for that mark:
| Reference | $/t |
|---|---|
| Trailing 5-year average (2021-2025, IMF series) | $123 |
| Post-2021 average (2022-2025) | $114 |
| Selborne planning price | $90 |
Even at that deliberately conservative $90/t, a producer with Vale’s $54.2/t all-in cost clears roughly $36/t. Both are delivered-to-China numbers, so they subtract cleanly, and the shorter-haul Pilbara operations clear more still. That is the through-cycle resilience the curve buys: the majors stay solidly cash-generative at prices that would shut the marginal Chinese and junior supply that sets the price. It is also why iron ore equities are valued on normalised, through-cycle earnings rather than screen-price annualisations.
Fortescue’s FY2025 numbers show the model working: US$7.9B of underlying EBITDA on 198.4 Mt shipped, carrying just US$1.1B of net debt. Vale’s Iron Ore Solutions segment earned $13.8B of EBITDA in CY2025 on 314.4 Mt sold. Cost-curve position converts directly into balance-sheet strength.
Four Companies, Two-Thirds of the Trade
The curve matters as much as it does because seaborne iron ore is extraordinarily concentrated. The seaborne trade ran to roughly 1.71 Bt in CY2024 (Kpler import data). Rio’s Pilbara shipments (328.6 Mt), BHP’s WAIO (290 Mt), Vale (314.4 Mt) and Fortescue (198.4 Mt) add to about 1,131 Mt, so the big four move around two-thirds of the market between them.
Concentration cuts both ways for the equity story. The bottom of the cost curve is crowded with disciplined, low-cost supply that rarely blinks in a downturn, yet any one major’s expansion decision still moves the supply side of the whole market. That is why the curve has stayed remarkably stable for a decade: nobody at the bottom has an incentive to crash the price they all harvest.
When you next see a broker table ranking the majors on a single C1 column, check for the footnotes. If wet and dry tonnes, June and December year-ends, and three different exclusion policies have been flattened into one tidy ranking, the ranking is noise. The definitions column is the analysis.
Steel & Bulk Commodities Primer
C1 is only part of what a tonne really costs. The primer builds the rest into a full iron-ore DCF.
The Excel model is the primer's three worked DCFs live across 13 sheets: change the mid-cycle spread, utilisation or discount rate and the valuation moves.
Frequently Asked Questions
- What is C1 cash cost in iron ore mining?
- C1 cash cost is the direct cost of producing a tonne of iron ore: mining, processing, rail and port. It excludes royalties, freight to the customer, sustaining capital and corporate costs. Each major defines it slightly differently, so the disclosed figures are not directly comparable without footnotes: Rio Tinto reports per wet metric tonne FOB, BHP excludes royalties and freight, Vale excludes third-party ore purchases, and Fortescue reports its hematite operations per wet metric tonne.
- Which iron ore major has the lowest C1 cash cost?
- On the latest disclosed figures, BHP's Western Australia Iron Ore at $17.29/t (financial year to June 2025) and Fortescue's hematite operations at $17.99/wmt (FY2025) sit at the bottom, with Vale fines at $21.3/t (CY2025) and Rio Tinto Pilbara at $23.5/wmt (FY2025) above them. The ranking shifts once you adjust for definitions and grade: Fortescue's lower-grade ore realised only 88% of the Platts 62% Fe index in the quarter to December 2025, so its margin advantage is smaller than its cost advantage.
- What is the difference between C1 cost and all-in cost in iron ore?
- C1 covers direct production costs only. The all-in cost adds freight to the customer, government royalties, sustaining capital expenditure and corporate overheads. Vale is the clearest disclosure: C1 of $21.3/t against an all-in cost of $54.2/t for CY2025, a gap of roughly $33/t. The all-in figure, not C1, is the number to test against your long-term iron ore price assumption.