Coking Coal Cost Curve: FOB Costs by Producer
The seaborne coking coal FOB cost curve: Stanmore, Coronado, Warrior, Alpha and BHP BMA, the short-ton vs metric-tonne trap, and cost against the PLV price.
Educational analysis for professional use. This guide is not investment advice or a recommendation to buy or sell any security, and it is not personalised.
In Coking Coal, the Cost Curve Is a Survival Table
Seaborne hard coking coal producers all sell into the same steelmaking market at a price set by the same premium low-vol benchmark, so what separates them is cost, not product. That is true of any bulk commodity, but it matters more in coking coal than in iron ore, because the price is violently cyclical. Premium low-vol traded above US$600 a tonne in 2022 and fell to roughly US$180 by late 2025. Through a swing that large, cost-curve position is not a margin nicety; it decides who keeps earning at the bottom and who burns cash.
So the FOB cost curve is the first table in any coking coal model, and it is also one of the easiest to read wrongly, because the producers report their costs in two different units and under three different labels.
The Disclosed FOB Cost Curve
Here is the curve on the latest full-year disclosures, converted to a common metric-tonne basis. Read the unit and label column before the cost column.
| Producer | FOB cost (US$/t metric) | As reported | Basis / label | Period |
|---|---|---|---|---|
| Stanmore Resources | 88 | US$87.80/t | FOB cash cost, metric tonne | FY2025 |
| Coronado Global Resources | 98 | US$97.5/t | mining cost per tonne sold (narrower than FOB) | FY2025 |
| Warrior Met Coal | 103 | US$93.53/short ton | cash cost of sales, FOB port, short ton | FY2025 |
| Alpha Metallurgical | ~110 | ~US$100/short ton | met cost of coal sales, short ton | FY2025 |
| BHP (BMA) | 128 | US$127.50/t | unit cost, metric tonne | FYE 30 Jun 2025 |
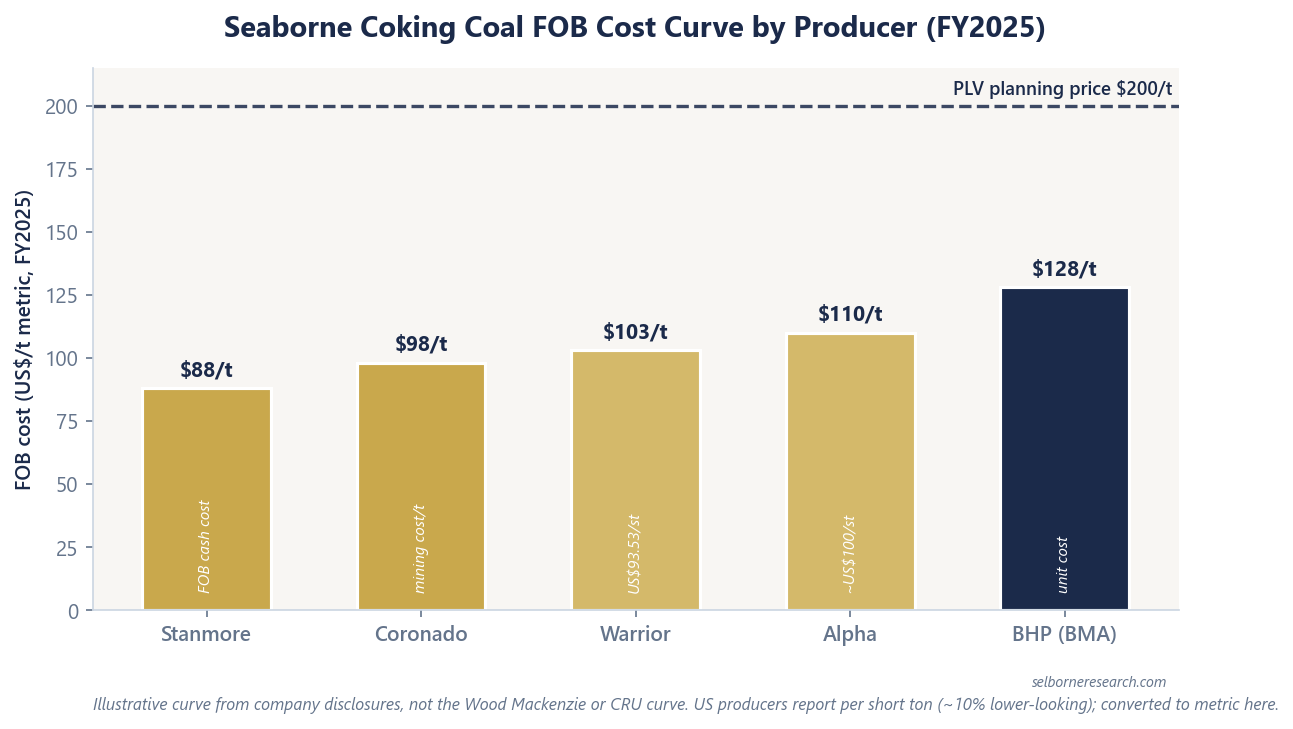
This is an illustrative curve, built from each producer’s own disclosed FOB cost, not the proprietary seaborne coking coal cost curve that Wood Mackenzie or CRU sell. Its value is the teaching in the footnote column, not a precise ranking: a broker table that flattens these into one number will mislead, because three things move underneath it.
- The US figures are reported per short ton. Warrior and Alpha report cost per short ton, which is 0.9072 of a metric tonne. On the raw figures Warrior’s US$93.53 looks like the second-lowest on the curve; converted to about US$103 per metric tonne it is above Coronado. The conversion is not optional if you are ranking Australian and US producers on one chart.
- The labels are not the same scope. Stanmore reports an FOB cash cost, Coronado a mining cost per tonne sold (which stops short of some FOB items and so reads low), Alpha a cost of coal sales, and BHP a unit cost. They overlap but they are not identical, and Coronado’s in particular will sit lower than a like-for-like FOB figure.
- The periods differ. BHP’s BMA runs a June financial year; the others report calendar 2025.
The discipline is the same one iron ore analysts apply to the C1 cost curve: the headline cost is a starting point, and the footnote telling you the unit and the definition is where the comparison lives.
The Short-Ton Trap Is the One That Bites
Of the three, the unit difference is the one that quietly reorders the curve, because it looks like a like-for-like comparison when it is not. A short ton is 2,000 pounds; a metric tonne is 2,205. So a cost quoted per short ton is spread over about 10% less coal than the same cost per metric tonne, and it prints about 10% lower for no operational reason at all. When a US producer reports US$93.53 and an Australian producer reports US$97.5, the instinct is to rank the US mine cheaper. On the same metric-tonne basis the US mine is roughly US$103 and sits above. Two of the five producers on this curve report in short tons, so the error is not a corner case; it is much of the table.
Convert everything to one unit first, then rank. The rest of the analysis, price realisation, coke quality, mine life, is worthless if the cost axis is mixing tons and tonnes.
Cost Against the Price: Where the Margin Lives
A cost curve only means something against a price. The premium low-vol benchmark averaged around US$196 a tonne in the year to mid-2025, and our planning price is $200/t (worked examples use demonstration prices; check the current coking coal price when modelling). Against that mark the whole disclosed cost curve, US$88 to US$128 a tonne, sits well below the price, so every producer on it earns a wide FOB margin when the price is near its planning level.
The margin is wide but it is not stable, and that is the whole point of the curve. Premium low-vol is one of the most volatile bulk commodities there is: the same benchmark that averaged around US$196 was above US$600 in 2022 and near US$180 by late 2025. At US$180 a tonne, a producer at US$128 FOB is earning a thin margin before royalties and capital, while one at US$88 still has room. So the cost curve earns its keep in the trough, where it separates the producers who keep generating cash from the ones who do not. Rank on cost, but stress the price, because coking coal punishes a high-cost tonne far faster than iron ore does.
What the Cost Curve Leaves Out
FOB cash cost is not the full cost of a tonne of coking coal, and it is not the whole of the investment case. It stops before government royalties, which are material and rising in Queensland, before sustaining capital, and before the freight and any price adjustment for coal that does not quite meet the premium low-vol spec. A producer selling a semi-soft or a high-vol product realises a discount to the PLV benchmark, so its effective margin is narrower than a cost-versus-PLV comparison suggests. That quality discount is a second axis on top of the cost curve, and it is covered in the met coal versus thermal coal guide.
So build the curve on one unit, read the definitions, and then lay the price volatility and the quality discount over it. A single tidy ranking of FOB numbers, half in short tons and half in tonnes, against a spot price that will not last, is three mistakes stacked into one chart. The cost curve is the foundation; it is not the answer on its own.
Steel & Bulk Commodities Primer
Cost-curve position decides who survives the price troughs. The primer builds it into a full met-coal DCF.
The Excel model is the primer's three worked DCFs live across 13 sheets: change the mid-cycle spread, utilisation or discount rate and the valuation moves.
Frequently Asked Questions
- What does it cost to produce seaborne coking coal?
- On the latest full-year disclosures, the major seaborne hard coking coal producers report FOB cash costs clustered between roughly US$85 and US$130 a tonne: Stanmore at US$87.80/t, Coronado around US$97.5/t, Warrior at US$93.53 per short ton (about US$103/t on a metric basis), Alpha's met segment around US$100 per short ton, and BHP's BMA at US$127.50/t. The figures are not strictly comparable, because US producers report per short ton while Australian producers report per metric tonne, and the cost definitions differ.
- Why do US and Australian coking coal costs look different?
- Two reasons, and both flatter the US figures if you skip them. First, US producers report cost per short ton, which is 0.9072 of a metric tonne, so a US dollars-per-short-ton figure understates the cost per metric tonne by about 10%. A US figure of about US$93 per short ton looks below an Australian producer's US$97 per tonne until you convert it to roughly US$103 per metric tonne, at which point it is above. Second, the labels differ: an FOB cash cost, a mining cost per tonne sold, and a cost of coal sales are not the same scope. Convert to one unit and read the definitions before ranking.
- How does the coking coal cost curve compare to the price?
- The premium low-vol (PLV) hard coking coal benchmark averaged around US$196/t FOB Australia in the year to mid-2025, well above the US$85-130/t cost band, so producers earn a wide margin when the price holds. The catch is volatility: PLV traded above US$600/t in 2022 and fell to roughly US$180/t by late 2025. That swing is far larger than iron ore's, so a producer's position on the cost curve matters most in the troughs, when the low-cost tonne keeps earning and the high-cost tonne does not.