Agribusiness · Ag Processing & Trading
Ag Processing Margin per Tonne by Segment
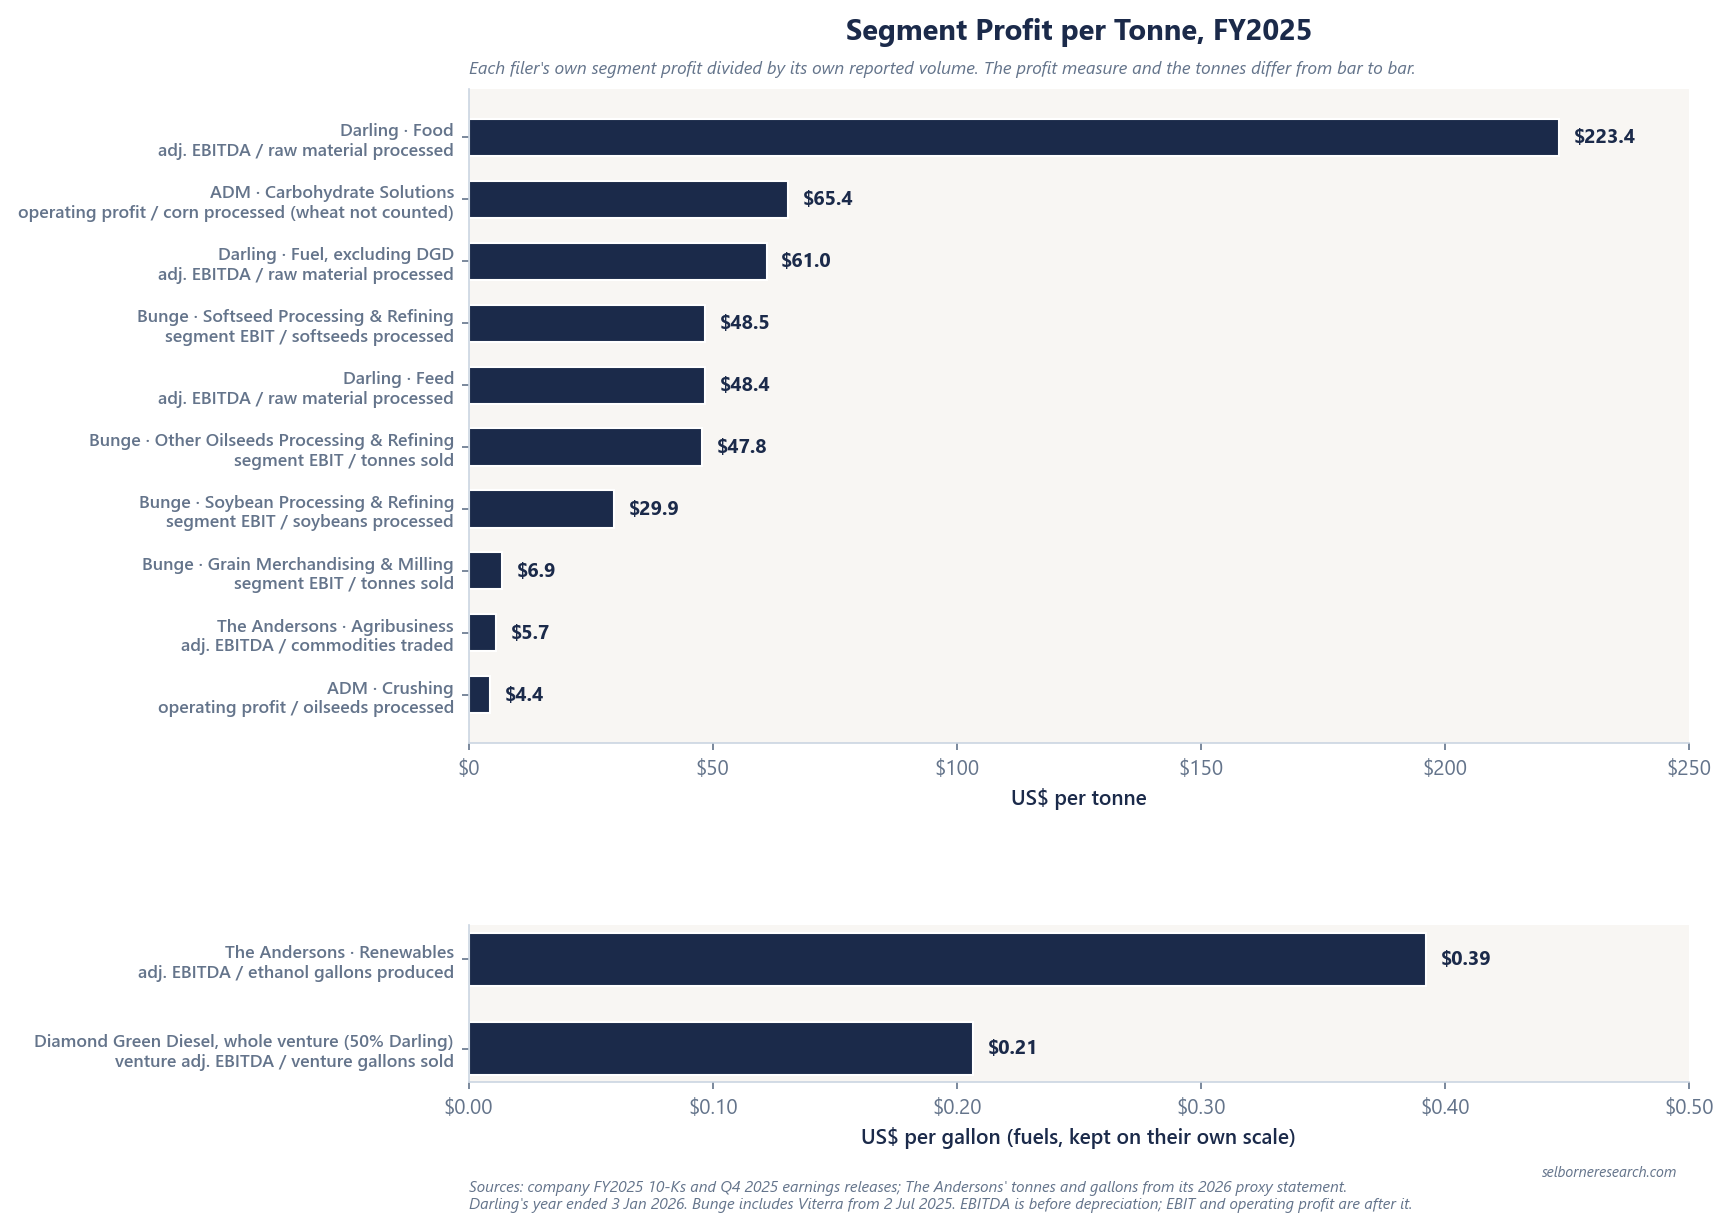
FY2025 segment profit per tonne ran from $4.4 at ADM's Crushing to $223.4 at Darling's Food. How to work it out, and why the metric and tonnes set the order.
Selborne Research · Ag Processing & Trading coverage: 7 guides, 5 company profiles, a primer and Excel model
Educational analysis for professional use. This guide is not investment advice or a recommendation to buy or sell any security, and it is not personalised.
On this page
Profit Is a Thin Margin on a Very Large Volume
Grain merchants and oilseed processors make a few dollars on each tonne they trade and tens of dollars on each tonne they crush, so their profit is a thin margin multiplied by an enormous volume. Ten segments at four US-listed companies earned between $4.4 and $223.4 a tonne in FY2025. The order follows what each segment does to the tonne: buys and resells it, crushes it into meal and oil, or turns it into a specialty product. It also follows which profit line and which tonnes each company reports. It says little about who runs their plants better.
Profit per tonne, as used here, is a segment’s own profit measure divided by the volume the same company reports for that segment in the same year; no company files it as a ratio. The profit is whatever the segment note uses: segment EBIT at Bunge, segment operating profit at Archer-Daniels-Midland (ADM), segment adjusted EBITDA at Darling Ingredients and The Andersons. EBITDA is struck before depreciation, so it reads higher per tonne than EBIT would for the same business. The volume is whichever tonnes the company reports: seed crushed (“processed”), product sold to outside customers, raw material taken in, or commodities traded. Both labels belong beside every figure.
FY2025 Profit per Tonne, Ten Segments
| Company and segment | FY2025 profit, company’s measure | Volume, million tonnes | $ per tonne |
|---|---|---|---|
| Darling Ingredients, Food | $294.9M adjusted EBITDA | 1.32 raw material processed | 223.4 |
| ADM, Carbohydrate Solutions | $1,211M operating profit | 18.53 corn processed | 65.4 |
| Darling Ingredients, Fuel, excluding its renewable diesel joint venture | $88.5M adjusted EBITDA | 1.45 raw material processed | 61.0 |
| Bunge, Softseed Processing & Refining | $521M segment EBIT | 10.75 softseeds processed | 48.5 |
| Darling Ingredients, Feed | $613.9M adjusted EBITDA | 12.68 raw material processed | 48.4 |
| Bunge, Other Oilseeds Processing & Refining | $118M segment EBIT | 2.47 sold | 47.8 |
| Bunge, Soybean Processing & Refining | $1,225M segment EBIT | 41.0 soybeans processed | 29.9 |
| Bunge, Grain Merchandising & Milling | $465M segment EBIT | 67.2 sold | 6.9 |
| The Andersons, Agribusiness | $186.7M adjusted EBITDA | 33 commodities traded | 5.7 |
| ADM, Crushing | $159M operating profit | 36.3 oilseeds processed | 4.4 |
Years to 31 December 2025; Darling’s ended 3 January 2026. Profit and tonnes come from each company’s FY2025 10-K and fourth-quarter 2025 earnings release, except The Andersons’ tonnes, which come from the summary of the year in its 2026 proxy statement. ADM’s Crushing is a subsegment of its Ag Services and Oilseeds segment, reported in the earnings release. ADM’s Carbohydrate Solutions also mills wheat, but ADM reports processed tonnes for corn only, so that figure is per tonne of corn. Softseeds are oilseeds such as rapeseed, canola and sunflower; Other Oilseeds covers palm, coconut and other specialty oils.
Fuels are sold by the gallon, so the two fuel businesses get their own table.
| Company and segment | FY2025 profit, company’s measure | Volume, million gallons | $ per gallon |
|---|---|---|---|
| The Andersons, Renewables | $203.1M adjusted EBITDA | 518 ethanol produced | 0.39 |
| Diamond Green Diesel, whole venture (Darling owns 50%) | $207.4M adjusted EBITDA | 1,003 renewable diesel sold | 0.21 |
Diamond Green Diesel’s row is the whole venture: twice Darling’s $103.7M half-share of its adjusted EBITDA, after broker and discount fees, over all the gallons it sold. The $0.21 is Darling’s own figure on that basis. The Andersons’ Renewables segment also sells ethanol made by other producers, and those gallons are not in the 518 million.
What the Segment Does to Each Tonne
The table falls into three groups, set by how much work goes into a tonne before it is sold.
Trading earns the least. Bunge’s Grain Merchandising & Milling and The Andersons’ Agribusiness buy grain from farmers, store it, ship it and sell it on, and their margin is the gap between buying and selling prices less freight and storage. That comes to a few dollars a tonne. ADM’s own trading business, Ag Services, earned $636M in FY2025, but ADM reports tonnes only for the oilseeds and corn it processes, so its trading profit has no volume to divide by.
Crushing sits in the middle. A crusher buys seed and sells the meal and oil pressed from it, and Bunge’s three oilseed segments also refine that oil. Darling’s Feed segment lands among them for a similar reason: rendering splits animal by-products into fats and protein meals, much as a crusher splits a seed. ADM’s Crushing line is the outlier, for reasons set out in the next section.
Making a product earns the most per tonne. Darling’s Food segment turns hides, skins, bones and intestines into collagen, natural sausage casings and crude heparin, the raw material for a blood-thinning drug. ADM’s Carbohydrate Solutions turns corn into sweeteners, starches and ethanol. Each tonne goes through more steps and is sold to a customer’s specification, where a traded tonne is sold at the going market price.
Same Profit, Different Tonnes
The tonnes you divide by can move the answer as much as the business does. Bunge’s Soybean Processing & Refining segment crushed 41.0 million tonnes of soybeans in FY2025, sold another 20.5 million tonnes of whole soybeans to outside customers, and refined 3.6 million tonnes of oil. Its $1,225M of EBIT covers all three. Divide by crushed plus traded tonnes, 61.5 million, and the $29.9 a tonne in the table falls to $19.9. Neither is wrong, but two figures compare only when they divide by the same kind of tonne.
Segment boundaries matter as much. ADM’s Crushing line holds only the crush: ADM books oil refining in a separate subsegment, Refined Products and Other, which earned $529M, and grain trading in Ag Services. Bunge’s soybean segment holds crushing, refining and soybean trading in one line. Part of the gap between their figures is a gap in what each line contains.
The profit line matters too. Bunge’s segment EBIT is the reported figure, and it carries mark-to-market timing differences: swings in the value of hedges, freight contracts and inventory that Bunge’s adjusted figures move out. Grain Merchandising & Milling’s $465M also includes a $155M gain on selling Bunge’s North American corn milling business in 2025. Without it the segment earned $310M, or $4.6 a tonne. Bunge completed its acquisition of Viterra, another grain merchant, on 2 July 2025, so its FY2025 profit and tonnes both carry Viterra for the second half only.
Tonnes to Bushels
US soybean prices are quoted per bushel, so a per-tonne figure often needs converting. The US Department of Agriculture weighs a bushel of soybeans at 60 lb, and a metric tonne is 2,204.6 lb, so a tonne holds 36.74 bushels. Divide a soybean figure per tonne by that factor: Bunge’s soybean segment earned $0.81 a bushel crushed. Other grains have other bushel weights, so the factor is for soybeans only.
That $0.81 is not a crush margin. The board crush, set out in the crush margin guide, is a gross spread built from futures prices for beans, meal and oil, before any cost of running a plant. Segment EBIT comes after running costs, depreciation and overheads, and Bunge’s also includes refining and soybean trading. The two measure different things, so one cannot be read against the other.
One Segment, Two Years
A year’s profit per tonne records that year’s spread. ADM processed 35.7 million tonnes of oilseeds in FY2024 and slightly more in FY2025, yet Crushing profit fell from $844M, or $23.6 a tonne, to the figure in the table. ADM’s earnings release puts the fall down mainly to lower crush margins. With volume that steady, the per-tonne figure moved with margin and plant costs, which is why one year’s figure should carry its year wherever it is quoted.
What Profit per Tonne Leaves Out
It says nothing about the money tied up behind each tonne. A trader carries grain in store and money owed by customers; a processor carries a plant. A few dollars on a tonne that turns over in weeks and tens of dollars on a tonne that needs a costly plant cannot be ranked against each other on this measure alone. The working capital guide covers the trader’s side.
Nor does it compare across companies unless the profit line, the tonnes and the segment boundary all match, and in this table they rarely do. The Andersons’ figure is the roughest. Its tonnes count commodities traded, taken from the proxy statement, while its profit covers the whole segment, including fertiliser and feed businesses whose volumes the proxy lists separately. The value chain guide shows how each company’s segments map onto trading, processing and ingredients.
Ag Processing and Trading Sector Primer
Profit per tonne is margin times volume. The primer builds a fictional crusher's earnings from tonnes and a net margin per bushel, then values it over ten years.
- 15 sections, from how a merchant earns to a ten-year DCF and leverage net of readily marketable inventories
- 40 pages
- a merchant oilseed crusher and an ingredients processor, each on the same ten-year DCF
- 2 company engines
- listed merchants, processors and ingredients companies on filed FY2025 figures
- 5-company screen
The Excel model is the primer's through-cycle valuation live across 11 sheets: a merchant crusher tab, with the board crush reverting from its starting point to mid-cycle and working capital funded each year, and an ingredients tab, each running a ten-year free-cash-flow schedule; a valuation summary setting each DCF beside the through-cycle multiple, with the gap split into what the weak years cost and how much more the multiple pays than the cash flows support; cycle scenarios, a crush-margin and ROIC view, a leverage screen with and without readily marketable inventories and two live sensitivity grids. Change the crush, the throughput or the WACC and the value moves.
See what's in the Ag Processing and Trading Sector Primer →£25 PDF · £59 with the Excel model · £159 for all three Agribusiness industries
Frequently Asked Questions
- How do you calculate profit per tonne for an ag processor?
- Divide a segment's own profit measure by the volume the same company reports for that segment in the same year. Bunge's Soybean Processing and Refining segment earned $1,225M of segment EBIT in FY2025 on 41.0 million tonnes of soybeans processed, or $29.9 a tonne. Name the profit line (EBIT, operating profit or adjusted EBITDA) and the tonnes (processed, sold or traded) beside every figure, because either can move the result as much as the business does.
- What was Bunge's EBIT per tonne in FY2025?
- On each segment's own volume: $48.5 a tonne in Softseed Processing and Refining, $47.8 in Other Oilseeds, $29.9 in Soybean Processing and Refining and $6.9 in Grain Merchandising and Milling. The two seed-crushing segments divide by tonnes processed, the other two by tonnes sold. Grain's $465M includes a $155M gain on selling the North American corn milling business, and all four include Viterra only from 2 July 2025.
- How do you convert soybean profit per tonne to per bushel?
- Divide by 36.74, the number of 60 lb soybean bushels in a metric tonne (2,204.6 lb divided by 60). Bunge's soybean segment at $29.9 a tonne is $0.81 a bushel. The result is still segment profit after plant costs and depreciation, so it is not a crush margin and cannot be read against the board crush.
- Why is ADM's Crushing profit per tonne lower than Bunge's soybean segment?
- Partly because the two lines hold different businesses. ADM's Crushing subsegment holds only the crush; its oil refining sits in Refined Products and Other and its grain trading in Ag Services. Bunge's soybean segment holds crushing, refining and soybean trading together. The year matters too: ADM's Crushing earned $844M in FY2024 on similar volume, $23.6 a tonne, against $4.4 in FY2025, and ADM put the fall mainly down to lower crush margins.
Read next
Crush Margins Explained (Soybean)
The CME board-crush formula, the crush ADM executes against the board, and why a through-cycle model uses a long-run crush.
Origination, Processing and Ingredients
The ag value chain from farm origination through crush and refining to specialty ingredients: ADM and Bunge segment maps, and why INGR, DAR and ANDE need different lenses.
The ABCD Agricultural Traders
ADM, Bunge, Cargill and Louis Dreyfus as origination-and-processing merchants; private-peer scale, Bunge's post-Viterra four-segment map, and why no filing uses the ABCD label.
See it applied
These company profiles apply the concepts from this guide to real public companies.