Agribusiness · Aquaculture
Salmon Farming Economics: Cost per kg
Mowi's cost-in-box definition, Grieg's filed cost build, and why each farmer's EBIT per kg must be read on its own basis before comparing farmers.
Selborne Research · Aquaculture coverage: 7 guides, 6 company profiles, a primer and Excel model
Educational analysis for professional use. This guide is not investment advice or a recommendation to buy or sell any security, and it is not personalised.
On this page
Every Farmer Draws Its Own Line
Cost per kg and EBIT per kg are the two numbers that describe a salmon farm, and no two farmers define them the same way. Cost per kg is what it took to grow a kilo of fish and, depending on the company, to process and pack it. Operational EBIT per kg is the profit on each kilo harvested, leaving out changes in the estimated value of fish still in the sea. Per kg means per kg of gutted weight: the fish bled and gutted, head on.
Of the six listed farmers profiled here, only Mowi and Grieg Seafood file a cost per kg for FY2025. All six give operational EBIT per kg, but some include the profit their processing and sales businesses make on the fish and others stop at the farm gate. Read the definition before setting two figures side by side.
Mowi’s Cost in Box
Mowi, the largest salmon farmer, filed a cost of EUR 5.49/kg for FY2025, averaged across its seven countries, down 5% from EUR 5.80 in 2024; Q4 2025 alone was EUR 5.36/kg. Mowi calls it cost in box: the total cost of one kg of gutted salmon packed in a standard box for shipping.
| Part of Mowi’s cost in box | What it covers |
|---|---|
| Feed | Fish feed, EUR 2.34/kg in FY2025 |
| Other seawater costs | Smolt (young salmon put to sea), salaries, insurance, medication and other costs of growing fish at sea |
| Non-seawater costs | Transport from the sea site to the processing plant, primary processing, administration and exceptional mortality |
| Total | EUR 5.49/kg across Mowi’s seven farming countries |
From Mowi’s Annual Report 2025 and Q4 2025 report.
Feed is the largest item: Mowi puts it at about 40-45% of cost in box, and in FY2025 it was 43%. Mowi puts the 2025 fall down to lower feed prices and operational improvements.
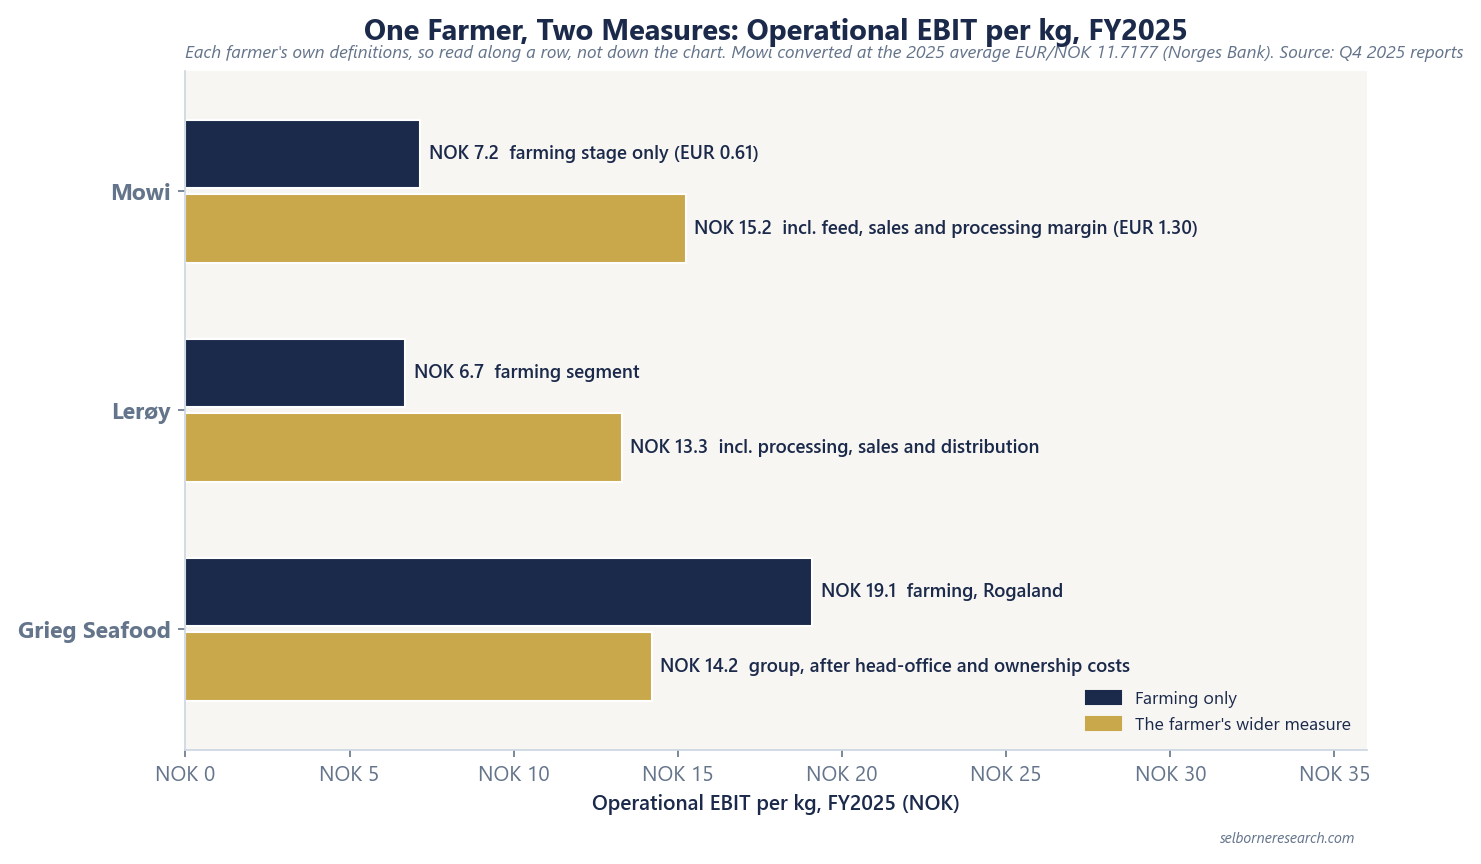
Mowi’s group operational EBIT was EUR 1.30/kg on 558,870 t. That includes the margin its feed and sales businesses earn on its own fish; the farming stage alone earned EUR 0.61/kg. At the 2025 average EUR/NOK rate of 11.7177 (Norges Bank), EUR 1.30 is about NOK 15.2/kg; convert at the average rate of the period the result covers. The profit by country guide splits the figure across Mowi’s seven countries.
Grieg’s Filed Cost Build (Rogaland Only)
Grieg Seafood is the other farmer that files a farming cost per kg: NOK 61.4/kg on FY2025 continuing operations, against NOK 63.0/kg in FY2024. Harvest was 30,462 t gutted weight, all from Rogaland in south-west Norway, because Grieg sold Finnmark, British Columbia and Newfoundland to Cermaq on 29 December 2025.
| Grieg FY2025 (continued ops) | NOK/kg |
|---|---|
| Revenue | 80.5 |
| Farming cost | (61.4) |
| Farming operational EBIT | 19.1 |
| Other costs, incl. ownership and head office | (4.9) |
| Group operational EBIT | 14.2 |
With Rogaland its only region, the NOK 4.9/kg gap between the two EBIT figures is cost that sits above the farm. Farming cost per kg leaves it out. So Grieg’s NOK 61.4/kg and Mowi’s EUR 5.49/kg measure different things: Grieg’s stops at the farm, Mowi’s runs to a packed box.
Other Farmers File EBIT per kg, Each on Its Own Basis
SalMar, Lerøy and Bakkafrost give operational EBIT per kg instead, each on its own perimeter.
| Company | FY2025 operational EBIT/kg | What it includes |
|---|---|---|
| SalMar | NOK 13.6/kg | Group, incl. sales and processing; 284,500 t |
| SalMar Northern Norway | NOK 20.7/kg | One region |
| SalMar Central Norway | NOK 6.3/kg | One region |
| Lerøy | NOK 6.7/kg | Farming only; 195,555 t |
| Lerøy | NOK 13.3/kg | Farming plus processing, sales and distribution |
| Bakkafrost Faroes | DKK 5.17/kg (NOK 8.12/kg) | Farming only; 83,638 t |
| Bakkafrost Scotland | DKK -17.77/kg | Farming only; 23,185 t; a loss |
SalMar’s NOK 13.6/kg averages very different regions: Northern Norway earned NOK 20.7/kg and Central Norway NOK 6.3/kg, while Iceland (NOK -16.7/kg) and its offshore farming venture SalMar Ocean (NOK -23.7/kg) lost money.
The chart pairs each farmer’s farming-only figure with its own wider one. The wider measure doubles Lerøy’s figure and more than doubles Mowi’s, yet cuts Grieg’s by a quarter. Set Mowi’s NOK 15.2 beside Lerøy’s NOK 6.7 and Mowi looks twice as profitable per kg; on farming alone the two are close, at NOK 7.2 and NOK 6.7. Compare farming with farming.
Worked Bridge: Price to EBIT/kg
Most of a kilo’s cost is spent before the fish is sold, so a change in the salmon price flows almost entirely to EBIT per kg. Take a hypothetical mid-scale Norwegian farmer: 150,000 t/yr harvest and NOK 60/kg farming cost including depreciation, at an illustrative long-run salmon price of 68 NOK/kg.
| Line | NOK/kg |
|---|---|
| Long-run salmon price (illustrative) | 68.0 |
| Farming cost | (60.0) |
| Operational EBIT/kg | 8.0 |
At NOK 8/kg on 150,000 t, operational EBIT is NOK 1.2bn. If the salmon price is NOK 5/kg higher while costs hold, EBIT/kg rises to NOK 13/kg, adding NOK 750m to EBIT before tax. NOK 68/kg is deliberately conservative: Statistics Norway’s weekly export price for fresh farmed salmon averaged NOK 81.79/kg in 2025 and NOK 94.44/kg in 2024 (table 03024, simple average of 52 weeks). The spot price guide explains the choice.
The worked example uses illustrative prices, not a forecast.
From EBIT per kg to Value
EBIT per kg times harvest is where a valuation of a farmer starts. In Norway that profit is taxed twice: 22% corporate tax plus, since 1 January 2023, a 25% resource-rent tax on farming salmon in the sea, 47% in all. The EV/kg valuation guide takes the step to value.
Two fictional salmon farmers and a farm you set up yourself, each valued after tax year by year, with EV per kg and an EBIT multiple as cross-checks.
- 15 sections, from how a salmon farmer earns to licence capacity, biological risk and a worked valuation
- 40 pages
- a low-cost scale farmer, a high-cost regional farmer and a farm you set up yourself
- 3 farm engines
- listed salmon farmers across Norway, the Faroes, Scotland and Chile on filed FY2025 figures
- 6-company screen
The Excel model is the primer's farming valuation live across 12 sheets: two hypothetical farmers and a farm you set up yourself, each valued on an after-tax DCF that includes Norway's resource-rent tax on salmon farming, with EV per kg and an EBIT multiple as cross-checks; a valuation summary, an EBIT-per-kg and cost-stack view, capacity against EV per kg, a cycle and biological downturn scenario and a live sensitivity grid of salmon price against farming cost. Change the price, the farming cost or the harvest and the value moves.
See what's in the Aquaculture Sector Primer →£25 PDF · £59 with the Excel model · £159 for all three Agribusiness industries
Frequently Asked Questions
- How does Mowi define farming cost per kg?
- Mowi's EUR 5.49/kg for FY2025 is its realised blended full cost, which it calls cost in box: the total cost of one kg of gutted salmon packed in a box for shipping. It covers feed, other costs at sea (smolt, salaries, insurance, medication), and the costs after the sea: transport to the processing plant, primary processing, administration and exceptional mortality. It was down 5% from EUR 5.80 in 2024; Q4 2025 alone was EUR 5.36/kg.
- Can you compare salmon farmers on operational EBIT per kg?
- Only on matching definitions. Each farmer draws its own line. Mowi's EUR 1.30/kg includes the margin its feed and sales businesses earn on its fish; its farming stage alone earned EUR 0.61/kg. Lerøy files NOK 6.7/kg for farming and NOK 13.3/kg for its whole value chain. Grieg Seafood files NOK 19.1/kg for farming and NOK 14.2/kg after head-office costs. Compare farming with farming, and convert currencies at the average rate of the same period.
- What goes into a salmon farmer's cost per kg?
- Feed is the largest item: Mowi puts it at about 40-45% of its cost in box, and in FY2025 its feed cost was EUR 2.34 of the EUR 5.49/kg. The rest is smolt (young salmon put to sea), salaries, insurance, medication and lice treatment, depreciation of pens and boats, then transport, processing and mortality. Because the fish in the water have already consumed most of that cost, a change in the salmon price flows almost entirely to EBIT per kg.
- How do filed cost/kg and EBIT/kg differ for Grieg Seafood?
- Grieg FY2025 continued-operations farming cost was NOK 61.4/kg (versus NOK 63.0/kg in FY2024) on 30,462 t Rogaland harvest. Against revenue of NOK 80.5/kg, that left farming operational EBIT of NOK 19.1/kg. After NOK 4.9/kg of other costs, including ownership and head-office costs, group operational EBIT was NOK 14.2/kg. Cost per kg is the input; EBIT per kg is what is left after the price realised and every other cost.
Read next
Salmon Spot Prices and the Cycle
SISALMONI versus Fish Pool versus the SSB export price, the 2025 supply surge, and the reference prices salmon farmers file.
EV/kg: Valuing Aquaculture Capacity
Enterprise value per kg of gutted-weight harvest capacity, how to strip non-farming assets out of EV, and why EV/kg is an analyst convention no company files.
Biological Risk: Lice, Mortality, Regulation
Norwegian sea lice limits, traffic-light capacity effects, FY2025 mortality and survival markers at Mowi, Lerøy and Grieg, and how biology flows to EBIT/kg.
Salmon Farming Profit per kg by Country
Mowi's operational EBIT per kg across its seven farming countries, why the order is price less cost rather than cost, and how mortality and processing profit set it.
Operational EBIT vs Reported EBIT in Salmon Farming
How IAS 41 values fish still in the sea at forward prices, what operational EBIT removes, and the FY2025 reconciliations at five salmon farmers.
See it applied
These company profiles apply the concepts from this guide to real public companies.