Agribusiness · Aquaculture
Operational EBIT vs Reported EBIT in Salmon Farming
Salmon farmers value fish in the sea at forward prices, so reported EBIT moves before a fish is sold. What operational EBIT removes, from five FY2025 filings.
Selborne Research · Aquaculture coverage: 7 guides, 6 company profiles, a primer and Excel model
Educational analysis for professional use. This guide is not investment advice or a recommendation to buy or sell any security, and it is not personalised.
On this page
- Reported EBIT Counts the Price Before the Fish Is Sold
- How IFRS Values a Fish Still in the Sea
- A Fictional Farm Through Two Quarters
- The Production Fee and the Resource-Rent Tax
- FY2025: Operational to Reported EBIT at Five Farmers
- Why the Five Gaps Differ
- One Quarter Against the Whole Year
- Which Figure Answers Which Question
- What Operational EBIT Leaves Out
Reported EBIT Counts the Price Before the Fish Is Sold
A salmon farmer’s reported EBIT moves when the expected salmon price moves, before a single fish is harvested. International accounting rules (IFRS) value fish still in the sea at what they are expected to fetch at harvest, less the cost of getting them there, and every change in that value runs through profit. Operational EBIT takes the change out, with a few other items each farmer lists, and leaves the profit on fish harvested and sold in the period. Use it for EBIT per kg and for setting one farming year beside the next; net profit, tax and earnings per share are all struck after the fair value line.
At five listed farmers in FY2025, reported EBIT ran from 39% to 132% of operational EBIT. Fair value moved all five. Mowi, the one farmer whose reported figure came out higher, owed it to a gain in its share of associated companies.
No accounting standard defines operational EBIT. Mowi, SalMar, Lerøy, Grieg Seafood and Bakkafrost each publish their own, with a reconciliation to reported EBIT in their quarterly reports, and their lists of what they remove overlap without matching.
How IFRS Values a Fish Still in the Sea
The standard is IAS 41, Agriculture. It measures living animals and plants at fair value less costs to sell, and in the IFRS Foundation’s words, changes in fair value “are included in profit or loss”. Roe, fry and smolt stay at cost, because they have grown little since they were hatched or bought. Fish at sea are valued on a model, which the farmers describe in the notes to their Q4 2025 reports:
- Price. The forward price for the month each fish is expected to be harvested, which SalMar and Lerøy take from Euronext Salmon Futures, where salmon is traded for future delivery, adjusted for export, harvesting and transport costs and expected quality. At 31 December 2025, SalMar’s model used NOK 99.69/kg for fish due in the first quarter of 2026 and NOK 75.51/kg for the third.
- Cost to finish. Fish below harvest weight carry a deduction for the cost still needed to grow them. Lerøy and Grieg Seafood treat a salmon as ready at 4 kg gutted weight.
- Discounting. The expected cash flow is discounted at a monthly rate, which Lerøy says covers the risk of incidents, a notional licence lease and the time value of money. At 31 December 2025, Lerøy used 4.0% a month and SalMar 5.75% in Norway.
The gap between that value and what the fish cost to raise is the fair value adjustment on the balance sheet. At 31 December 2025, Grieg Seafood’s biological assets had cost NOK 1,260.3m and were carried at NOK 1,519.7m, an uplift of NOK 259.4m. The fair value line in the income statement is the change in that uplift over the period. At harvest the uplift drops out, and the profit appears in operational EBIT as the fish are sold.
The value is sensitive to the price assumption. Mowi estimates that a EUR 0.10/kg lower salmon price in all its markets would have cut the fair value of its fish at 31 December 2025 by EUR 24.6m.
A second line moves with the first. A farmer that has sold fish forward at a fixed price counts their fair value as part of the cost of delivering them, and books a provision for an onerous contract (one that will lose money) if that cost exceeds the contract price. Because the cost includes the fair value uplift, a contract can be onerous on paper even when its price is above what the fish cost to produce, as Lerøy’s note points out. When forward prices rise, the two lines partly offset: in Q4 2025 SalMar booked a NOK 179m fair value gain and NOK 83m of onerous contract provisions.
A Fictional Farm Through Two Quarters
A farm has 20,000 tonnes of fish in the sea, all at harvest weight and due to be harvested next quarter. At the end of quarter one, the forward price for next quarter’s harvest rises by NOK 5/kg. Ignore discounting over the weeks to harvest, and suppose the fish are then sold at that higher price.
| NOK m | Quarter 1 | Quarter 2 | Both quarters |
|---|---|---|---|
| Extra revenue at the higher price, in operational EBIT | 0 | 100 | 100 |
| Fair value adjustment | 100 | (100) | 0 |
| Change in reported EBIT | 100 | 0 | 100 |
In quarter one the uplift rises by 20,000 tonnes times NOK 5/kg, NOK 100m, and reported EBIT takes it; operational EBIT does not move, because nothing extra has been sold. In quarter two the fish sell for NOK 100m more, and the fair value line gives the uplift back as they leave the sea. Both measures book the same NOK 100m over the two quarters; they differ in when.
Had the forward price fallen back before harvest, the NOK 100m would have reversed in quarter two with no extra revenue behind it.
The Production Fee and the Resource-Rent Tax
Norway charges salmon and trout farmers a production fee on every kg harvested, NOK 0.965/kg from 1 January 2025. It depends on volume rather than profit, so the accounts book it as an operating cost, but farmers remove it from operational EBIT because it belongs with Norway’s tax on salmon farming. Since 1 January 2023, profit from farming salmon and trout at sea has borne a 25% resource-rent tax on top of 22% corporate tax, 47% in all. The fee is credited against the rent tax: while rent tax is payable, each krone of fee reduces it by a krone, and fee left over is lost. Lerøy’s note calls the fee the minimum tax a Norwegian sea farmer pays on top of ordinary tax.
The rent tax is an income tax, charged below EBIT, so it appears in neither figure. A model built on operational EBIT has to charge the rent tax itself, with the fee as its floor.
FY2025: Operational to Reported EBIT at Five Farmers
The table groups each company’s reconciliation into four kinds of item.
- Fair value items: the change in fair value of fish in the sea, onerous contract provisions, and unrealised gains or losses on salmon futures and forward contracts. SalMar’s also include the uplift on fish in companies it bought, charged as those fish were sold.
- Production or revenue tax: in Norway, the production fee explained above. Mowi’s line also carries licence fees and a Faroese sales tax; SalMar’s includes a resource tax in Iceland; Bakkafrost’s is what it calls revenue tax, most of it booked in its Faroese farming.
- Other items: restructuring, impairments and their reversals, legal claims and anything else the company excludes as non-operational.
- Associates: the farmer’s share of profit from companies it part-owns, where it counts that share inside reported EBIT.
| Company (currency, m) | Operational EBIT | Fair value items | Production or revenue tax | Other items | Associates | Reported EBIT |
|---|---|---|---|---|---|---|
| Mowi (EUR) | 726.8 | (34.7) | (55.1) | (102.7) | 426.1 | 960.5 |
| SalMar (NOK) | 3,867 | (505) | (307) | (139) | booked below | 2,916 |
| Lerøy (NOK) | 2,501.7 | (1,162.4) | (188.7) | (91.5) | (89.1) | 970.0 |
| Grieg Seafood (NOK) | 432.8 | (149.5) | (34.7) | 47.2 | inside operational EBIT | 295.8 |
| Bakkafrost (DKK) | 887.5 | 128.1 | (173.9) | none | 36.1 | 877.8 |
Years to 31 December 2025, from each company’s Q4 2025 report. Reported EBIT is the line each company labels EBIT, except at SalMar, whose reconciliation starts from operating profit and which books associates below it. Lerøy’s own reconciliation starts from operating profit of NOK 1,059.2m, before associates. Grieg Seafood’s figures cover continuing operations only, its Rogaland farms, after it sold its other regions in December 2025; its other item is the reversal of an earlier write-down of intangible assets. Mowi’s other items include EUR 54.3m of impairments, among them intangible assets in Canada East, and its columns add to EUR 0.1m less than its reported EBIT because of rounding.
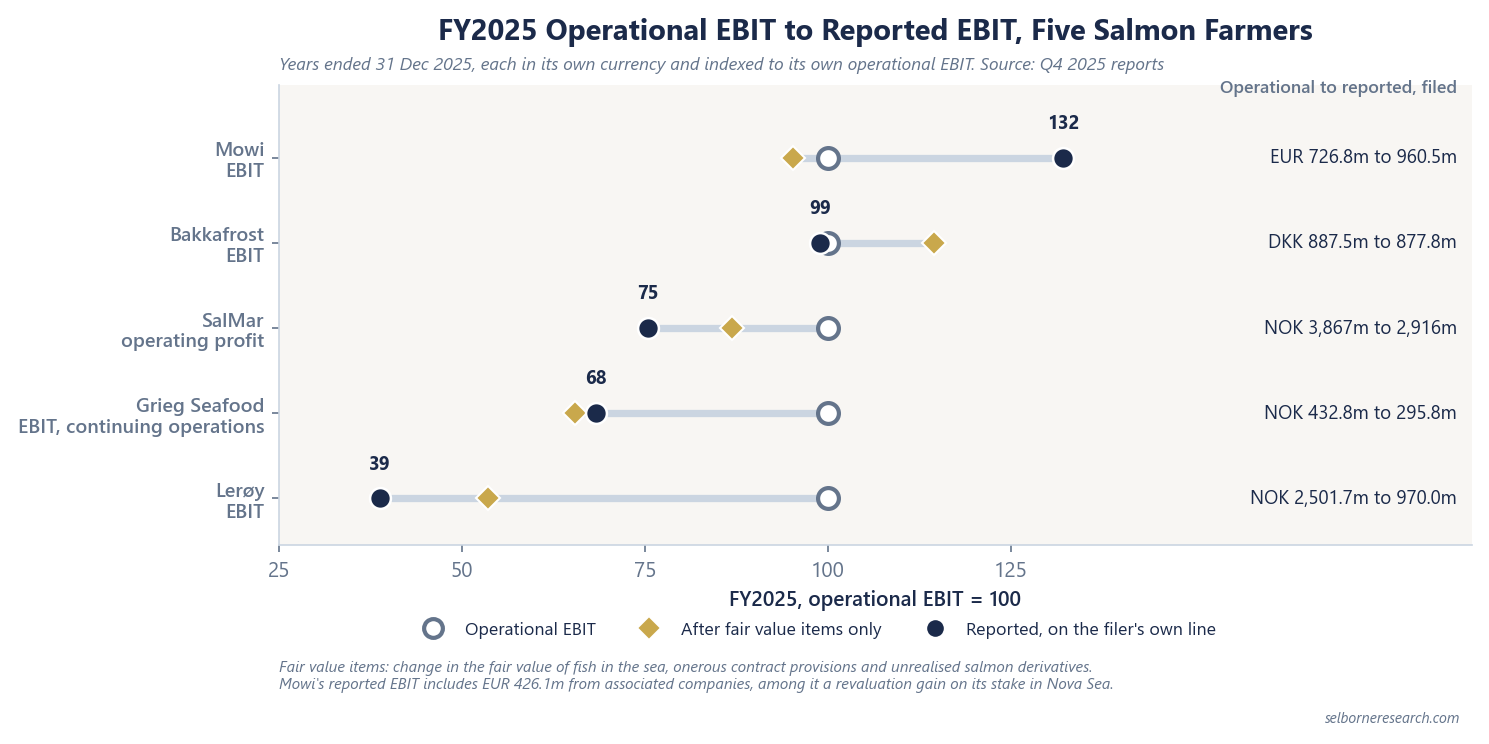
Why the Five Gaps Differ
Each gap has its own main item, and at three of the five it is fair value.
Lerøy: the value of fish still in the sea. The uplift on Lerøy’s fish in the sea fell from NOK 3,022.7m at 31 December 2024 to NOK 1,792.8m a year later. The quantity barely changed: 110,342 tonnes live weight at the start of the year, 109,259 at the end. So the NOK 1,229.9m fall, before onerous contracts, came from a lower value per kg on a similar stock.
Bakkafrost: fair value up, revenue tax down. Its uplift rose from DKK 373m to DKK 501m over 2025, and its revenue tax took all of that gain back and more.
Grieg Seafood: fair value, partly offset. Grieg puts its fair value charge down mainly to lower forward prices, with changes in biomass and harvest timing. The write-down reversal recovered part of it.
SalMar: several items together. Fair value items took 13% off operational EBIT, and the production tax, legal claims and restructuring most of the rest.
Mowi: associates. Fair value items took less than 5% off. Mowi counts its share of associated companies inside EBIT, and in 2025 that line included a gain from revaluing its existing stake in Nova Sea, another Norwegian farmer, when it bought control in the fourth quarter.
One Quarter Against the Whole Year
A year nets out swings that a quarter does not. In Q4 2025, fair value items were positive at all five farmers, and Mowi and Grieg both said forward prices had risen since the end of September.
| Company (currency, m) | Q4 2025 operational EBIT | Q4 2025 fair value items | Q4 2025 reported EBIT |
|---|---|---|---|
| Mowi (EUR) | 212.5 | 117.5 | 665.1 |
| SalMar (NOK) | 1,834 | 86 | 1,748 |
| Lerøy (NOK) | 758.1 | 184.6 | 811.8 |
| Grieg Seafood (NOK) | 142.9 | 38.3 | 216.9 |
| Bakkafrost (DKK) | 295.3 | 569.7 | 827.5 |
Same bases as the full-year table. The rows do not add across because production taxes, other items and associates sit between the columns shown; Mowi’s Q4 reported EBIT includes EUR 416.2m from associates, among them the Nova Sea gain. Lerøy’s fourth-quarter fair value gain came after NOK 1,347.0m of fair value charges in the first nine months of 2025, so its fourth quarter on its own shows reported EBIT above operational EBIT, the reverse of its year.
Which Figure Answers Which Question
- EBIT per kg, and a farm’s price against its cost: operational EBIT divided by tonnes harvested; Mowi’s FY2025 figure over its 558,870 tonnes gutted weight gives EUR 1.30/kg. The cost per kg guide builds the margin from price and cost.
- Net profit, tax and earnings per share: reported figures, since they are struck after the fair value line, and deferred tax is booked on the uplift.
- Comparing two farmers: operational EBIT, after reading both reconciliations line by line, because associates, one-offs and taxes are treated differently.
- What the forward market expected at a balance sheet date: the biological assets note, which states the prices the model used. The spot price guide covers the salmon price benchmarks behind them.
What Operational EBIT Leaves Out
Each farmer draws it differently. Lerøy removes one-off items only above NOK 15m. Grieg Seafood keeps inside operational EBIT its share of associates that form part of a region’s operations. Mowi’s includes realised gains and losses on currency hedges tied to contract sales.
Nor is it cash. Operational EBIT is struck after depreciation, and a farmer growing its stock ties up cash in fish at their cost of production, which neither EBIT figure shows. The cash flow statement does.
And it records one year’s prices and costs. Operational EBIT per kg in a year of high prices says little about a year of low ones, so quote it with its year.
Operational EBIT is where a farm valuation starts. The primer builds fictional farms' EBIT from harvest, salmon price and cost per kg, then values them after tax.
- 15 sections, from how a salmon farmer earns to licence capacity, biological risk and a worked valuation
- 40 pages
- a low-cost scale farmer, a high-cost regional farmer and a farm you set up yourself
- 3 farm engines
- listed salmon farmers across Norway, the Faroes, Scotland and Chile on filed FY2025 figures
- 6-company screen
The Excel model is the primer's farming valuation live across 12 sheets: two hypothetical farmers and a farm you set up yourself, each valued on an after-tax DCF that includes Norway's resource-rent tax on salmon farming, with EV per kg and an EBIT multiple as cross-checks; a valuation summary, an EBIT-per-kg and cost-stack view, capacity against EV per kg, a cycle and biological downturn scenario and a live sensitivity grid of salmon price against farming cost. Change the price, the farming cost or the harvest and the value moves.
See what's in the Aquaculture Sector Primer →£25 PDF · £59 with the Excel model · £159 for all three Agribusiness industries
Frequently Asked Questions
- What is operational EBIT in salmon farming?
- It is EBIT with the fair value adjustment on fish still in the sea taken out, together with other items each farmer lists, such as production fees, restructuring and impairments. No accounting standard defines it, so each company publishes its own definition and a reconciliation to reported EBIT in its quarterly report. Divided by the tonnes harvested, it gives operational EBIT per kg, the unit margin every listed farmer reports.
- What is the fair value adjustment on biomass?
- IAS 41 requires fish at sea to be carried at fair value less costs to sell rather than at what they cost to raise. Farmers estimate that value from forward salmon prices for the month each fish is expected to be harvested, less harvesting and transport costs and the cost still needed to grow fish below harvest weight, discounted monthly. The fair value adjustment in the income statement is the change in the gap between that value and cost over the period, so it moves with the forward price before any fish is sold.
- Why do Norwegian farmers exclude the production fee from operational EBIT?
- Norway charges a production fee on every kg of salmon and trout harvested, NOK 0.965 per kg from 1 January 2025. It is booked as an operating cost but works as part of the salmon tax: the fee is credited against the 25% resource-rent tax, so while rent tax is payable each krone of fee reduces it by a krone. Farmers therefore group it with tax.
- How far apart were operational and reported EBIT in FY2025?
- At five listed farmers, reported EBIT ran from 39% of operational EBIT at Lerøy to 132% at Mowi. Lerøy's operational EBIT was NOK 2,501.7m and its reported EBIT NOK 970.0m, mostly because the fair value of its fish in the sea fell by NOK 1,229.9m over the year. Mowi's reported EBIT of EUR 960.5m was above its operational EBIT of EUR 726.8m because it counts EUR 426.1m from associated companies inside EBIT.
Read next
Salmon Farming Economics: Cost per kg
What Mowi's cost in box and Grieg's farming cost include, and why each farmer's EBIT per kg has to be read on its own definition before comparing farmers.
Salmon Spot Prices and the Cycle
SISALMONI versus Fish Pool versus the SSB export price, the 2025 supply surge, and the reference prices salmon farmers file.
Reported vs Adjusted EBITDA in Chemicals
What six producers add back to reach adjusted EBITDA, why write-downs and closures dominate a bad year, and which figure answers which question.
See it applied
These company profiles apply the concepts from this guide to real public companies.