Agribusiness · Ag Processing & Trading
Crush Margins Explained (Soybean)
The CME board-crush formula, the crush ADM executes against the board, and why a through-cycle model uses a long-run crush rather than a spot price.
Selborne Research · Ag Processing & Trading coverage: 7 guides, 5 company profiles, a primer and Excel model
Educational analysis for professional use. This guide is not investment advice or a recommendation to buy or sell any security, and it is not personalised.
On this page
Board Crush Is the Benchmark; Executed Crush Is the P&L
A soybean crusher earns the gap between what it pays for beans and what it gets for the meal and oil pressed from them. Analysts measure that gap with the board crush, a formula set by CME Group, which runs the Chicago Board of Trade (CBOT) futures market. It turns the futures prices of soybeans, meal and oil into a gross margin per bushel. The margin a crusher actually locks in on physical trades, which ADM calls the executed crush margin, carries local cash prices, freight and timing, so the two move together but rarely match.
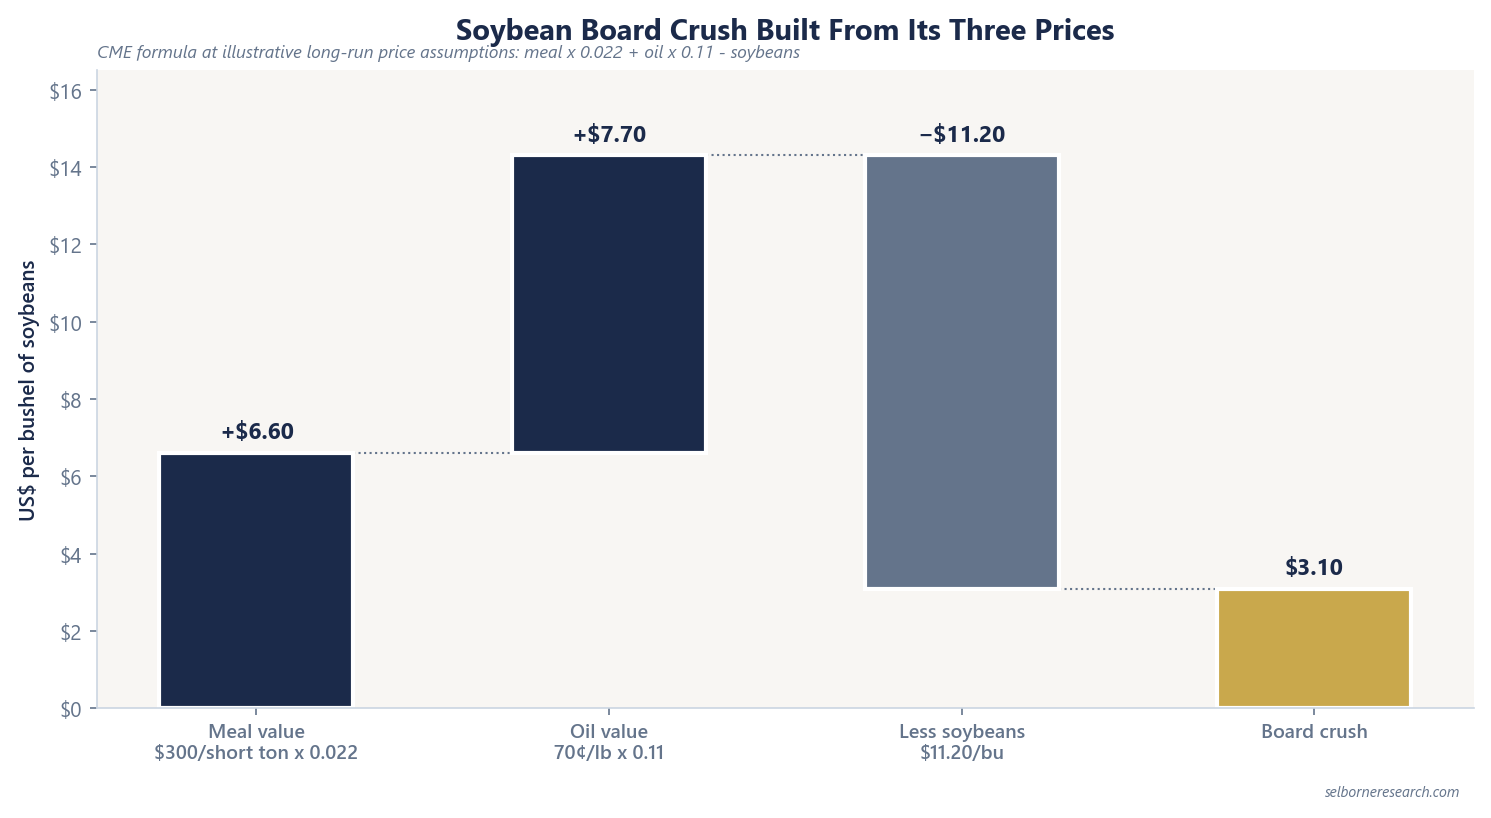
Value a crusher on a long-run crush. Today’s crush reflects one season’s prices, so it overstates mid-cycle EBITDA in a good year and understates it in a bad one. The illustrative long-run prices below give a board crush of $3.10/bu.
The CME Board-Crush Formula
CME Group defines the soybean crush as:
Board crush ($/bu) = (meal $/short ton × 0.022) + (oil ¢/lb × 0.11) − soybeans $/bu
A 60 lb bushel yields about 44 lb of meal and 11 lb of oil. 44 lb is 0.022 of a short ton (st, 2,000 lb), so 0.022 turns the meal price per short ton into meal value per bushel. 0.11 is the 11 lb of oil, divided by 100 to turn cents into dollars. Subtract the soybean price and you have the gross margin per bushel crushed.
| Component | Illustrative long-run price (June 2026) | Value per bushel |
|---|---|---|
| Soybean meal | $300/st | × 0.022 = $6.60 |
| Soybean oil | 70¢/lb | × 0.11 = $7.70 |
| Soybeans (CBOT) | $11.20/bu | less $11.20 |
| Board crush (computed) | $3.10/bu |
They are assumptions, and the primer’s Excel model runs on them.
Executed Crush Versus Board Crush at ADM
Archer-Daniels-Midland (ADM) says its Crushing subsegment is driven by executed crush margins, not the CME formula. Crushing earned $159M of operating profit in FY2025, down from $844M in FY2024; ADM put the fall down to lower soy and canola crush margins and higher plant costs. Crushing sits inside Ag Services & Oilseeds, ADM’s merchant segment, the business that buys, trades, ships and processes crops. That segment earned $1,614M in all: grain buying and trading $636M, Crushing’s $159M, oil refining and other products $529M, and $290M as ADM’s share of the profit of Wilmar, a Singapore-listed agribusiness group it part-owns. The value chain guide sets out the full map.
Bunge Global processed 51.8M MT of oilseeds in FY2025, 41.0M MT of them soybeans and 10.8M MT softseeds such as rapeseed and sunflower. Its Soybean Processing & Refining segment earned $1,225M of EBIT, against ADM’s $159M from Crushing on 36.3M MT of oilseeds. Much of that gap is scope: Bunge’s segment also refines oil, trades soybeans and makes biodiesel, while ADM books its refining and grain trading in other lines. The margin per tonne guide sets each segment’s profit against its own volume.
Scale multiplies a thin margin. Bunge’s 41.0M MT of soybeans is about 1.5 billion bushels, so each $0.10/bu of margin on them is worth about $150M a year.
Worked Example: From Board Crush to a Crusher’s EBITDA
Take the model’s illustrative crusher: 40M MT a year of oilseed capacity running at 90%. A metric tonne of soybeans is 36.74 bushels (2,204.6 lb ÷ 60 lb), so capacity is about 1,470M bushels and throughput about 1,323M bushels.
A crusher does not earn the full board crush. The model assumes it keeps 45% of it, losing the rest to local price differences, competition and timing, and pays $0.95/bu for energy, labour and plant upkeep:
Net crush margin = 45% × $3.10 − $0.95 = $0.445/bu
On 1,323M bushels that is about $589M of crush EBITDA a year. The model adds a flat $900M from buying, storing and trading grain, for mid-cycle EBITDA of about $1.49B.
A $0.10/bu move in the board changes this crusher’s net margin by only $0.045/bu, because it keeps 45% of the board. That is about $60M a year, against $132M if it kept the full move.
Fixed plant costs make a crusher’s profit swing harder than the board. The model’s example starts at a trough board crush of $2.40/bu, where the net margin is 45% × $2.40 − $0.95 = $0.13/bu. A 23% fall in the board takes 71% off the net margin, because the $0.95 of plant costs does not fall with it.
Working capital takes cash too. The model holds it at 10% of revenue, close to ADM’s FY2025 operating working capital, 9.8% of revenue. The meal and oil sell for the bean price plus the board crush, $14.30 a bushel at mid-cycle, so revenue is about $18.9B and working capital about $1.9B. The working capital guide covers how merchants report it.
What to Watch in Filings
Before putting a through-cycle multiple on a crusher’s EBITDA, restate the crush earnings at the long-run crush, so one season’s margin does not set the value. The valuation guide covers that step; the ABCD traders guide explains why merchants also earn outside the crush.
Ag Processing and Trading Sector Primer
A hypothetical merchant crusher and an ingredients processor valued year by year, with the crush recovering to a long-run level and ROIC set against the cost of capital.
- 15 sections, from how a merchant earns to a ten-year DCF and leverage net of readily marketable inventories
- 40 pages
- a merchant oilseed crusher and an ingredients processor, each on the same ten-year DCF
- 2 company engines
- listed merchants, processors and ingredients companies on filed FY2025 figures
- 5-company screen
The Excel model is the primer's through-cycle valuation live across 11 sheets: a merchant crusher tab, with the board crush reverting from its starting point to mid-cycle and working capital funded each year, and an ingredients tab, each running a ten-year free-cash-flow schedule; a valuation summary setting each DCF beside the through-cycle multiple, with the gap split into what the weak years cost and how much more the multiple pays than the cash flows support; cycle scenarios, a crush-margin and ROIC view, a leverage screen with and without readily marketable inventories and two live sensitivity grids. Change the crush, the throughput or the WACC and the value moves.
See what's in the Ag Processing and Trading Sector Primer →£25 PDF · £59 with the Excel model · £159 for all three Agribusiness industries
Frequently Asked Questions
- What is soybean crush margin?
- The gross margin on crushing soybeans into meal and oil: what the meal and oil sell for, less what the beans cost. The CME board crush computes it from futures settlement prices: (meal $/short ton (st) × 0.022) + (oil ¢/lb × 0.11) − soybeans $/bu. Crushers also track the margins they actually lock in on physical trades, which differ from the board formula.
- How do you calculate the soybean board crush?
- Board crush ($/bu) = (soybean meal $/short ton × 0.022) + (soybean oil ¢/lb × 0.11) − soybeans $/bu. The 0.022 and 0.11 factors turn the meal and oil prices into the value of the meal and oil in one bushel. At the illustrative long-run prices in this guide (beans $11.20/bu, meal $300/st, oil 70¢/lb) the board crush is $6.60 + $7.70 − $11.20 = $3.10/bu.
- Why do executed crush margins differ from board crush?
- Board crush is a futures benchmark. The margin a crusher actually earns, which ADM calls its executed crush margin, reflects local cash prices, freight and timing. In FY2025 ADM's Crushing subsegment earned $159M of operating profit, a small part of the $1,614M its Ag Services & Oilseeds segment earned.
- What board crush should valuation models use?
- A long-run crush computed from long-run prices for beans, meal and oil. The illustrative set in this guide (soybeans $11.20/bu, meal $300/st, oil 70¢/lb, set in June 2026) gives $3.10/bu. Capitalising a spot crush into a terminal value overstates the value when the spot crush sits above the long-run level, and understates it when it sits below.
Read next
The ABCD Agricultural Traders
ADM, Bunge, Cargill and Louis Dreyfus as origination-and-processing merchants; private-peer scale, Bunge's post-Viterra four-segment map, and why no filing uses the ABCD label.
Origination, Processing and Ingredients
The ag value chain from farm origination through crush and refining to specialty ingredients: ADM and Bunge segment maps, and why INGR, DAR and ANDE need different lenses.
Ag Processing Margin per Tonne by Segment
Segment profit divided by tonnes, from grain trading to crushing to ingredients: how to work it out, why the profit line and the tonnes must match, and how to convert to bushels.
See it applied
These company profiles apply the concepts from this guide to real public companies.