Agribusiness · Ag Processing & Trading
ROIC vs Adjusted ROIC in Ag Processing
ADM, Bunge and Ingredion each file two returns on capital. What each adjustment removes from earnings or capital, and why returns compare only on one basis.
Selborne Research · Ag Processing & Trading coverage: 7 guides, 5 company profiles, a primer and Excel model
Educational analysis for professional use. This guide is not investment advice or a recommendation to buy or sell any security, and it is not personalised.
On this page
The Gap Measures a Definition
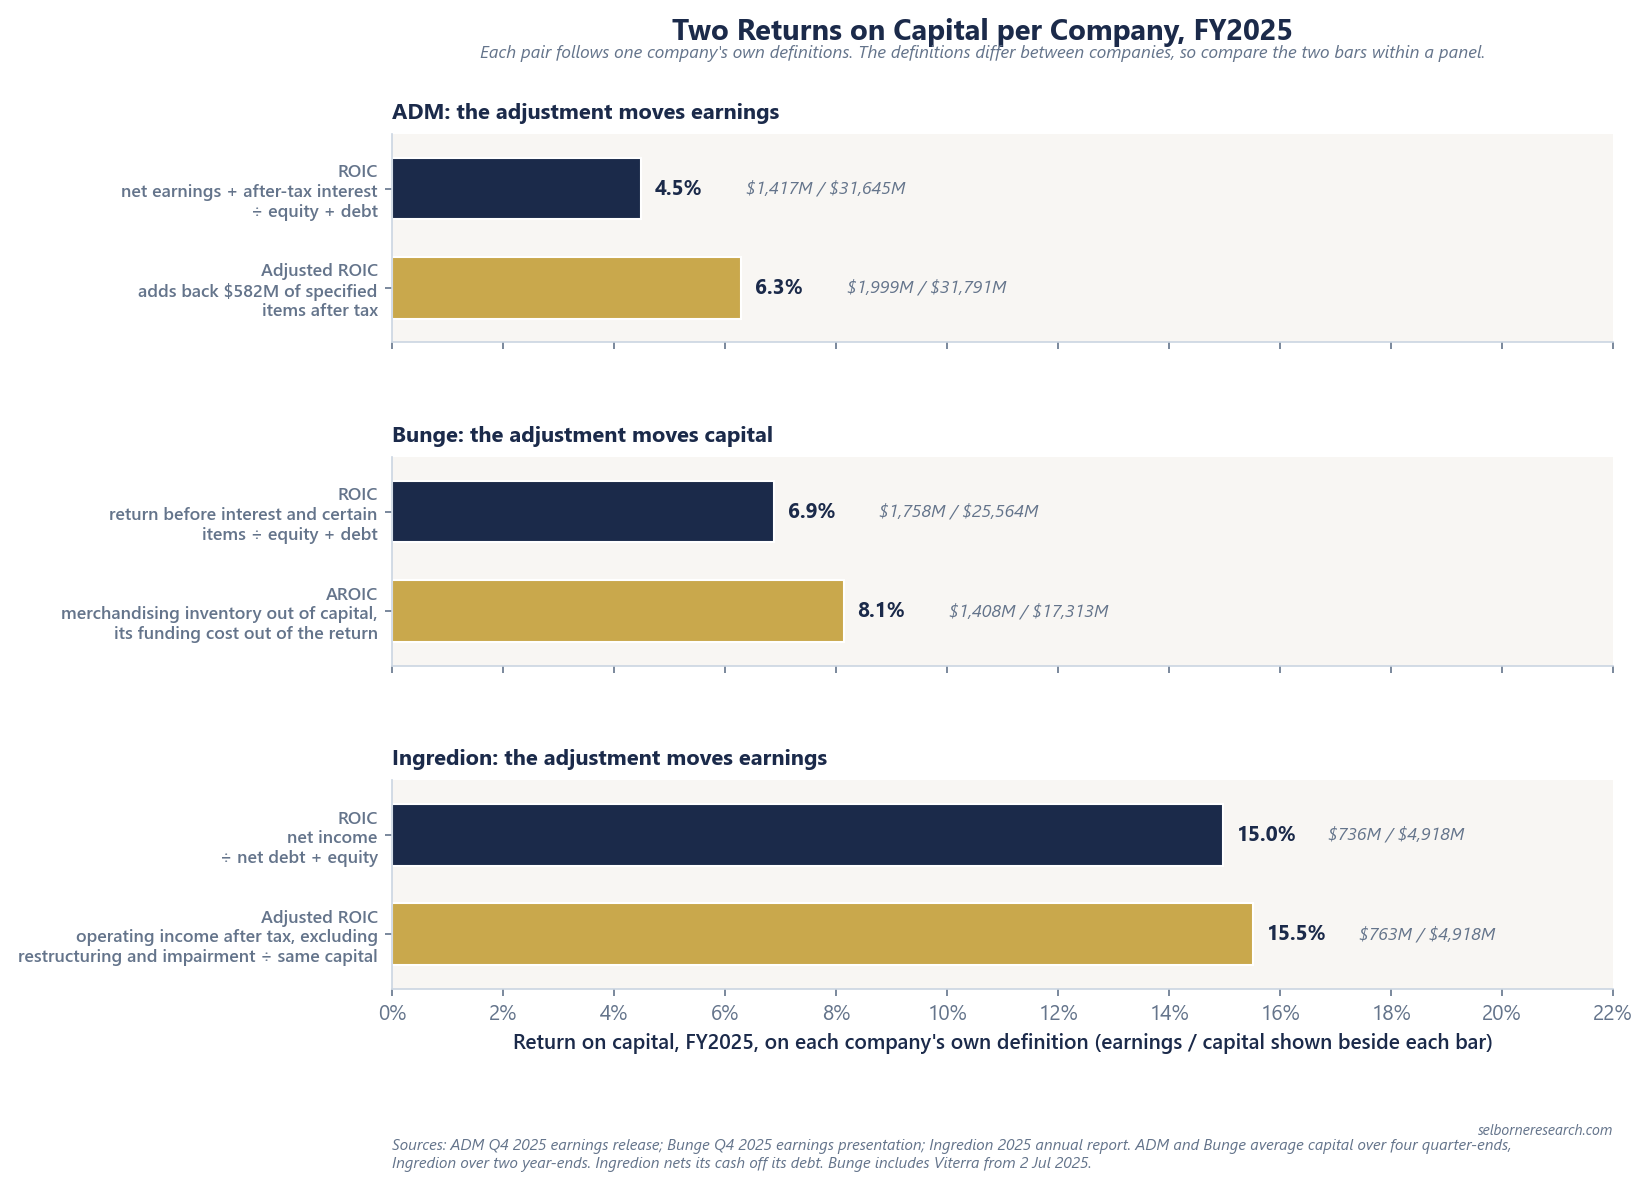
Archer-Daniels-Midland (ADM), Bunge and Ingredion each publish two returns on capital. The gap between each pair measures what the second definition removes, and says nothing about how well the business ran. At ADM the adjusted figure takes charges such as impairments and restructuring, its specified items, out of the earnings and moves the capital a little. Ingredion’s does the same and also swaps net income for operating income after tax. At Bunge it takes grain and oilseed inventory out of the capital. Each company also builds its first figure its own way, so two companies’ returns compare only after both are rebuilt on one definition.
Return on invested capital (ROIC) is after-tax operating earnings divided by the capital that shareholders and lenders have put into the business. No accounting standard defines it. Each company chooses the earnings line, what counts as capital and how the capital is averaged, then shows the arithmetic in a reconciliation table. Darling Ingredients and The Andersons, the other two listed processors covered here, publish no ROIC at all.
FY2025, Two Returns per Company
| Company | ROIC, company’s label | Adjusted return, company’s label | What the adjustment removes | Where the reconciliation sits |
|---|---|---|---|---|
| ADM | ROIC 4.5% | Adjusted ROIC 6.3% | Specified items, mostly from the earnings | Q4 2025 earnings release (8-K Exhibit 99.1) |
| Bunge | ROIC 6.9% | AROIC 8.1% | Inventory held for merchandising, from the capital, and its funding cost, from the return | Q4 2025 earnings presentation, appendix |
| Ingredion | ROIC 15.0% | Adjusted ROIC 15.5% | Swaps net income for operating income after tax, and removes restructuring and impairments | 2025 annual report, management’s discussion |
Years to 31 December 2025. ADM and Bunge measure the trailing four quarters and average capital over the four quarter-ends; Ingredion averages two year-ends. Bunge’s ROIC is itself adjusted: it already leaves out certain gains and charges and mark-to-market timing differences, the swings in the value of hedges and inventory that reverse when the trades settle.
What Each Company Puts In
A return is earnings divided by capital, and each reconciliation shows which of the two the adjustment moved.
| $M, FY2025 | ROIC earnings | Adjusted earnings | ROIC capital | Adjusted capital |
|---|---|---|---|---|
| ADM | 1,417 | 1,999 | 31,645 | 31,791 |
| Bunge | 1,758 | 1,408 | 25,564 | 17,313 |
| Ingredion | 736 | 763 | 4,918 | 4,918 |
ADM adds charges back to the earnings. Its ROIC earnings are net earnings attributable to ADM, $1,078M, plus $339M of interest on borrowings after tax. Its capital is equity, excluding outside shareholders’ stakes in subsidiaries, plus interest-bearing debt, with no cash netted off. The adjusted figure adds back $582M of specified items after tax: $776M of impairment, exit, restructuring and settlement charges, including the settlement of an SEC investigation, less $194M of gains and tax items. ADM also adjusts its capital for specified items, but by only $146M, so the earnings explain almost all of the 1.8-point gap.
Bunge takes inventory out of the capital. Readily marketable inventories (RMI) are agricultural commodities such as soybeans, meal, oil, corn and wheat that Bunge carries at market value because they trade in active markets and can be sold without further processing. AROIC removes the RMI Bunge holds for merchandising, $8,251M on average over the four quarters and about a third of its capital. It also removes the interest on the debt that funds that inventory, $455M before tax ($350M after) at a 5.51% average cost of debt, which is why the adjusted earnings are lower than the first figure’s. Bunge’s reason for the measure is that this inventory expands and contracts with the seasons, commodity prices and trading opportunities. The same inventory earns a 70% credit against debt in Bunge’s adjusted leverage ratio, which the working capital guide explains.
Ingredion changes the earnings line. Its ROIC divides net income by average net debt and equity. Net income is struck after interest, so the numerator has already paid the lenders whose money sits in the denominator. Adjusted ROIC puts back tax, $37M of financing costs, $5M of other non-operating expense and $12M of restructuring and impairment charges net of other gains, then taxes the result at a 25.8% adjusted effective rate. The result is adjusted operating income after tax, divided by the same capital. Ingredion also nets its $1,030M of cash at the end of 2025 off its debt. ADM counts its debt gross, and Bunge adjusts its capital for cash only once, for the $4,550M it held for the Viterra acquisition at 30 June 2025.
A Fictional Merchant, Three Ways
When the inventory’s funding cost is charged too, as Bunge does, taking the inventory out lifts a return only in proportion to how far the return beats that funding cost. A fictional merchant crusher shows why. It has $16,000M of invested capital, $5,000M of it readily marketable inventory. It crushes 40 million tonnes of oilseeds a year at a net margin of $0.445 a bushel and earns $900M from origination, so its mid-cycle EBITDA is $1,489M. After $500M of depreciation and 25% tax, its operating earnings are $741M.
| Fictional merchant, $M | Whole company | Inventory out of capital | Inventory out, funding cost charged |
|---|---|---|---|
| After-tax operating earnings | 741 | 741 | 535 |
| Invested capital | 16,000 | 11,000 | 11,000 |
| Return on capital | 4.6% | 6.7% | 4.9% |
The middle column is how the Excel model shows the merchant’s return without its inventory: the capital shrinks and the earnings stay put. The right-hand column follows Bunge’s method. The merchant borrows at 5.5% before tax to carry its inventory, close to Bunge’s 5.51%, so $206M a year of after-tax interest leaves the earnings along with the inventory. The uplift is the return less that after-tax funding rate of 4.125%, scaled by inventory over the capital left: (4.63% − 4.125%) × 5,000 ÷ 11,000 = 0.23 of a point. A merchant earning well above its funding cost would gain far more.
Against the model’s 9% cost of capital the merchant falls short on all three. Removing the inventory does not close the shortfall once the cost of capital is adjusted to match. The lower-cost debt behind the inventory leaves too, so the cost of the capital that remains rises from 9% to 11.2%.
Same Company, Two Years
A gap can halve without any change in definition. Recast onto the method Bunge adopted on 1 July 2025, so both years share one basis, its FY2024 ROIC and AROIC were 10.1% and 12.6%, a gap of 2.5 points, against 1.2 points in FY2025. In both years the inventory came to about 48% of the capital left once it was removed. What moved was the return: it fell towards the inventory’s after-tax funding cost, which was 4.9% in FY2024 and 4.2% in FY2025, so removing the inventory added less. Its FY2025 figures include Viterra, the grain merchant it bought, from 2 July 2025.
Where the adjustment is to earnings, the gap follows the year’s charges. Ingredion’s was 1.9 points in 2024, 12.9% against 14.8%, a year with $109M of impairments, mostly for three plant closures, and a $90M gain on selling its South Korea business. In 2025 it was 0.5 of a point.
What Neither Figure Tells You
Neither figure ranks the three companies. The earnings lines, the capital bases and the averaging all differ, and Bunge’s first figure is already adjusted. A comparison means rebuilding each return from its reconciliation on one earnings line and one capital base. The specialty chemicals ROIC guide builds a return from filed figures where a company publishes none.
Nor does an adjusted figure show whether the excluded items were one-offs. ADM excluded $539M of specified items after tax in FY2024 as well as the $582M in FY2025. Charges that recur at that size behave more like a running cost than an exception, and only the unadjusted figure carries them.
Cash is another matter. A merchant’s inventory and receivables can absorb cash in a year of solid earnings, as the working capital guide shows. And neither says what a return is worth. Setting a return against a cost of capital, and carrying it into a multiple, is the job of the valuation guide.
Ag Processing and Trading Sector Primer
Removing inventory from capital moves the return, not the business. The primer computes a fictional crusher's return with and without its inventory and values it over ten years.
- 15 sections, from how a merchant earns to a ten-year DCF and leverage net of readily marketable inventories
- 40 pages
- a merchant oilseed crusher and an ingredients processor, each on the same ten-year DCF
- 2 company engines
- listed merchants, processors and ingredients companies on filed FY2025 figures
- 5-company screen
The Excel model is the primer's through-cycle valuation live across 11 sheets: a merchant crusher tab, with the board crush reverting from its starting point to mid-cycle and working capital funded each year, and an ingredients tab, each running a ten-year free-cash-flow schedule; a valuation summary setting each DCF beside the through-cycle multiple, with the gap split into what the weak years cost and how much more the multiple pays than the cash flows support; cycle scenarios, a crush-margin and ROIC view, a leverage screen with and without readily marketable inventories and two live sensitivity grids. Change the crush, the throughput or the WACC and the value moves.
See what's in the Ag Processing and Trading Sector Primer →£25 PDF · £59 with the Excel model · £159 for all three Agribusiness industries
Frequently Asked Questions
- What is the difference between ROIC and adjusted ROIC?
- ROIC divides after-tax operating earnings by the capital shareholders and lenders have put into a business. No accounting standard defines it, so each company picks its own earnings line, capital base and averaging, and its adjusted ROIC then removes something more. At ADM the adjustment takes charges such as impairments and restructuring out of the earnings and moves the capital a little; Ingredion's also swaps net income for operating income after tax; at Bunge it takes grain and oilseed inventory held for trading out of the capital. The gap between the two figures measures what was removed, so it means something different at each company.
- What is Bunge's AROIC?
- Adjusted return on invested capital. Bunge starts from its ROIC, which already leaves out interest, certain gains and charges and mark-to-market timing differences. AROIC then takes the readily marketable inventory Bunge holds for merchandising out of the capital, and the cost of the debt that funds it out of the return. For the four quarters to 31 December 2025, $8,251M of average inventory came out of capital and $455M of pre-tax funding cost ($350M after tax) out of the return, giving AROIC of 8.1% against ROIC of 6.9%.
- How does ADM calculate adjusted ROIC?
- ADM divides adjusted ROIC earnings by adjusted invested capital. The earnings are net earnings attributable to ADM plus after-tax interest on borrowings, with specified items added back. The capital is equity, excluding non-controlling interests, plus interest-bearing liabilities, averaged over four quarter-ends and adjusted for specified items too. In FY2025 the specified items added $582M after tax to the earnings, mostly impairment, exit, restructuring and settlement charges, and $146M to the capital, taking the return from 4.5% to 6.3%.
- Why does Ingredion calculate ROIC on net income?
- Ingredion treats net income over average net debt and equity as the GAAP-based version of its measure, the comparable figure for its adjusted ROIC. Net income has already paid interest to the lenders whose money sits in that capital. The adjusted figure replaces it with adjusted operating income after tax: $763M against $736M in 2025, on the same $4,918M of capital, giving 15.5% against 15.0%.
Read next
Valuing Ag Processors (EV/EBITDA, ROIC)
Normalising EBITDA on a long-run crush, ROIC against WACC, and filed FY2025 returns on capital at Ingredion, Bunge and ADM, each on its own definition.
Working Capital in Commodity Trading
Why ag merchants carry large inventories and receivables: ADM operating WC $7.89B, Bunge RMI $11.36B, ANDE RMI $1.0B, and why adjusted leverage differs from GAAP net debt/EBITDA.
ROIC in Specialty Chemicals
Damodaran sector return on capital 10.95% vs WACC 7.25% (+3.70 pp spread); why FY2025 issuer ROIC is absent; how to read the spread.
See it applied
These company profiles apply the concepts from this guide to real public companies.