Chemicals · Commodity Chemicals
Reported vs Adjusted EBITDA in Chemicals
Four chemical producers added $1.4bn to $2.2bn to FY2025 EBITDA by adjusting. What the add-backs are, why write-downs dominate, and which figure to use.
Selborne Research · Commodity Chemicals coverage: 7 guides, 6 company profiles, a primer and Excel model
Educational analysis for professional use. This guide is not investment advice or a recommendation to buy or sell any security, and it is not personalised.
On this page
In a Bad Year, the Gap Is Write-Downs and Closures
In a bad year, the gap between a chemical producer’s reported and adjusted EBITDA is mostly impairments (write-downs of assets, including goodwill, the premium paid for past acquisitions), plant closures and restructuring. Four of six large commodity producers reported FY2025 adjusted EBITDA $1.4bn to $2.2bn above their EBITDA before adjustments, and at each of the four those three kinds of charge made up at least 88% of the difference. So the adjusted figure is the right place to start when normalising earnings.
Neither figure tells you what the year cost in cash. The reported one is dragged down by write-downs that cost no cash that year; the adjusted one leaves out closure costs that do.
No accounting standard defines EBITDA, so each company computes its own and shows the bridge to net income in a reconciliation at the back of its quarterly earnings release. The adjusted figure then removes items management treats as outside the running business, under a label the company chooses: Operating EBITDA at Dow and Celanese, EBITDA excluding identified items at LyondellBasell and Westlake, adjusted EBITDA at Olin and Methanex. The label says nothing about what was removed; the reconciliation does.
FY2025 EBITDA, Before and After Adjustments
| Company | The company’s label | EBITDA before adjustments ($M) | Adjusted EBITDA ($M) | Gap ($M) | Largest single line in the reconciliation |
|---|---|---|---|---|---|
| Dow | Operating EBITDA | 1,036 (calculated) | 3,256 | 2,220 | 2025 Restructuring Program, $862M |
| Celanese | Operating EBITDA | 271 (calculated) | 1,893 | 1,622 | Goodwill and trade-name impairment, $1,486M |
| LyondellBasell | EBITDA excluding identified items | 1,126 | 2,543 | 1,417 | Asset write-downs, $1,251M |
| Westlake | EBITDA excluding Identified Items | (248) | 1,144 | 1,392 | Goodwill impairment, $727M |
| Olin | Adjusted EBITDA | 619.4 | 651.8 | 32.4 | Restructuring, $33.4M |
| Methanex | Adjusted EBITDA | 843 (calculated) | 808 | (35) | Asset impairment, $71M |
Years ended 31 December 2025, from each company’s Q4 2025 earnings release; Methanex from its 2025 annual report, prepared under IFRS. Dow, Celanese and Methanex print no unadjusted EBITDA. For Dow and Celanese the figure shown is adjusted EBITDA less the adjustments that affect EBITDA; Celanese’s adjustments include $17M of accelerated depreciation, which stays excluded because it is depreciation. Methanex’s is consolidated EBITDA from its income statement.
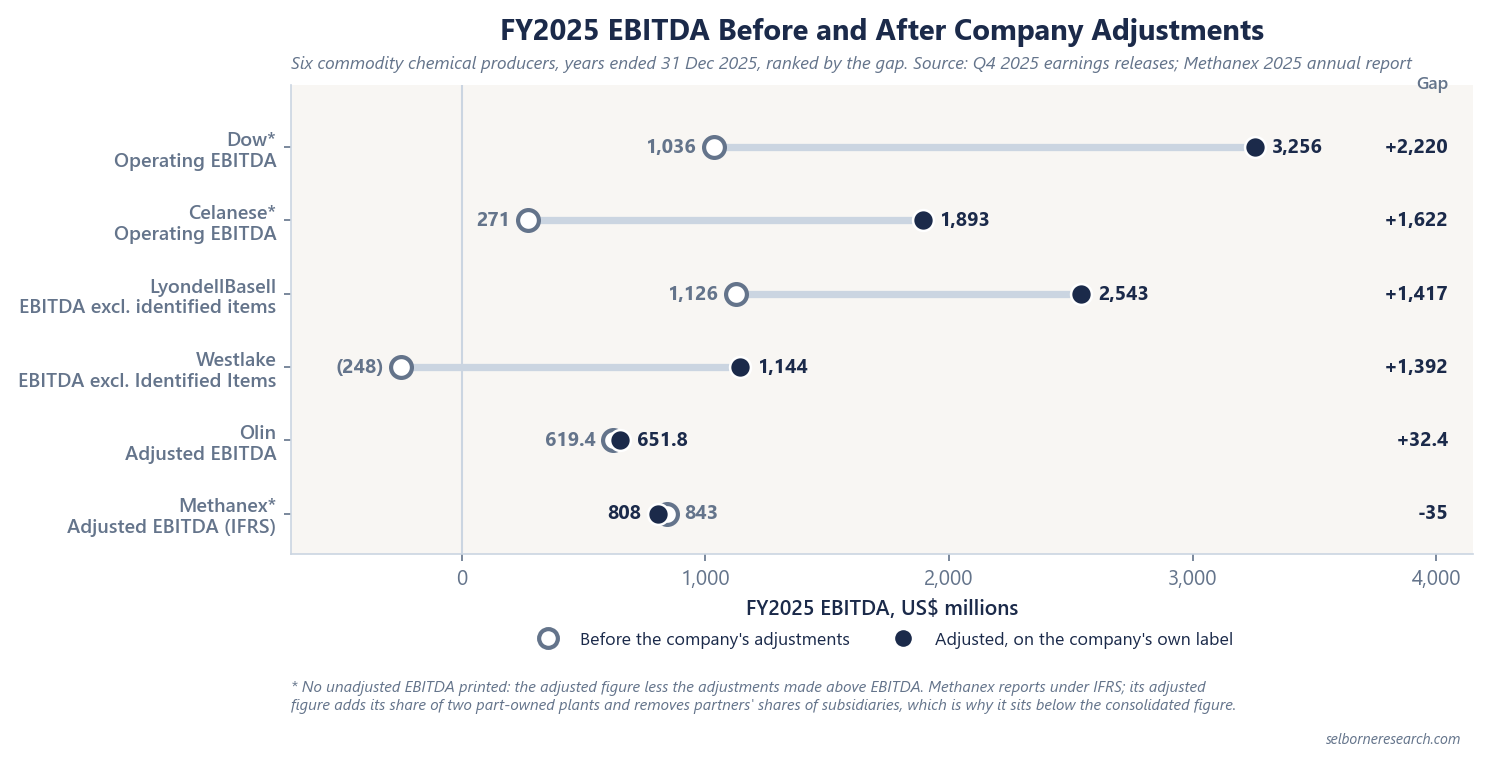
Westlake’s line crosses zero: before adjustments it made an EBITDA loss. Olin’s two figures barely differ, because its only adjustments were restructuring and a small environmental recovery. Methanex’s adjusted figure sits below its reported one, and no charge explains that. Its adjusted EBITDA counts only its ownership share of each plant, as explained below.
What Gets Added Back
| $M, FY2025 | Impairments | Closures and restructuring | Other, net | Total gap |
|---|---|---|---|---|
| Dow | 993 | 966 | 261 | 2,220 |
| Celanese | 1,513 | 98 | 11 | 1,622 |
| LyondellBasell | 1,251 | 185 | (19) | 1,417 |
| Westlake | 727 | 665 | – | 1,392 |
| Olin | – | 33.4 | (1.0) | 32.4 |
| Methanex | 71 | – | (106) | (35) |
Columns group the lines of each company’s reconciliation. Closures and restructuring covers severance, shutdown costs, write-offs of plant and inventory at sites being closed, and programme costs; Olin’s restructuring includes a $4.1M write-down at an epoxy plant it is closing in Brazil. Other, net mixes charges and gains:
- Dow: a $323M pension settlement, $115M of indemnification and transaction costs and a $78M loss on repaying debt early, less a $213M gain on disposals and a $42M litigation credit.
- Celanese: $52M of deal costs, $17M of legal costs and $8M of smaller items, less a $49M pension gain and the accelerated depreciation noted above.
- LyondellBasell: $36M of costs for a planned European sale and a $6M loss on a disposal, less $61M of EBITDA from its closed Houston refinery, which it reports as a discontinued business.
- Methanex: covered under ownership below.
Impairments were the largest item. They were $4,555M of the $6,648M the six added back between them, 69%. An asset is written down when the cash it is expected to earn no longer covers its book value; goodwill is tested at least once a year.
Four of the six wrote goodwill off in FY2025: Celanese $1,486M together with trade names, mostly its Zytel nylon brand; LyondellBasell $972M across two segments; Westlake $727M, all the goodwill of its North American chlorovinyls (chlorine and PVC) business; and Dow $690M in polyurethanes and construction chemicals. No cash leaves when the charge is booked. The cash went out years earlier, when the business was bought or the plant built, which is the case for adding it back.
Closures and restructuring are mostly cash, and they come back. Westlake’s fourth quarter carried $393M for closing three North American chlorovinyls plants and a styrene plant, plus $102M of accrued costs for shutting its Pernis site in the Netherlands. Severance and decommissioning are paid as sites close, and part of the bill lands after the year in which it was charged. At least four of the six also excluded restructuring or closure costs in FY2024: Dow $315M, Celanese $236M, Westlake $75M and Olin $33.3M, almost exactly its FY2025 charge.
Other items run both ways. Adjusted EBITDA removes gains as well as charges, such as Dow’s gain on disposals and Celanese’s pension gain. So adjusted is not always the higher figure.
Six Labels, Six Rulebooks
No standard sits behind any of these labels, so each adjusted figure answers a slightly different question. Five differences in the FY2025 filings are worth checking before two companies go side by side.
- Whether an unadjusted EBITDA is printed at all. Westlake, LyondellBasell and Olin print one. Dow, Celanese and Methanex start their reconciliations from net income, so you build it.
- What counts as an item. LyondellBasell removes asset write-downs only when they exceed $10M in aggregate for the period. Olin removes restructuring and “certain other non-recurring items”. Dow calls its list significant items; Celanese calls its list Certain Items.
- Financing lines. Celanese counts $68M of refinancing expense with interest, inside its basic formula. Dow lists its loss on repaying debt early as a significant item. Both end up outside adjusted EBITDA by different routes, and only Dow’s shows in the gap.
- Ownership. Methanex measures adjusted EBITDA on its economic share. It adds its 63.1% of the Atlas plant in Trinidad and 50% of the Natgasoline plant in Texas, which its accounts do not consolidate, and removes partners’ shares of the subsidiaries it controls. In FY2025 that took $79M off, more than the New Zealand impairment it added back. It also removes the effect of share-price moves on share-based pay, which cut the adjusted figure by a further $27M.
- Accounting rules. Methanex reports under IFRS, the other five under US GAAP.
One company can print more than one adjusted figure. LyondellBasell’s cash conversion ratio divides operating cash flow of $2,262M by a third EBITDA, $2,383M, which adds back only the write-downs and a loss on a sale and keeps the closure, restructuring and European sale costs in. That ratio was 95%.
A $500M Write-Down Through Both Figures
Take a fictional producer earning $900M of EBITDA from its running business. During the year it shuts one unit, writes the unit’s remaining book value down by $500M and books $120M of closure costs for severance and decommissioning. It pays $40M of those costs in the year and $80M the next.
| $M | Reported EBITDA | Adjusted EBITDA | Cash spent, this year | Cash spent, next year |
|---|---|---|---|---|
| Running business | 900 | 900 | ||
| Impairment of the closed unit | (500) | added back | 0 | 0 |
| Closure costs | (120) | added back | 40 | 80 |
| Total | 280 | 900 | 40 | 80 |
The two EBITDA figures differ by $620M, and neither is the cash the closure consumed. On the cash flow statement, the $500M is added back to net income as a non-cash charge, and the $80M still owed comes back through the rise in the closure provision. Cash spent on the closure this year: $40M. Next year the other $80M leaves with no charge in either EBITDA, because the cost was booked a year earlier. Adjusted EBITDA never shows it.
The write-down also changes the years after it. The unit carried $50M a year of depreciation, and with its book value gone that charge stops. EBIT rises by $50M a year from then on, and net income by the same less tax. EBITDA, adjusted or not, stays where it was, and so does cash.
Which Figure Answers Which Question
Each question has its own figure, and for one of them the answer is not an EBITDA at all.
- Normalising earnings. Start from adjusted EBITDA, because a goodwill write-off says nothing about what the plants will earn. Then put back what recurs: restructuring that shows up most years belongs in the running cost at its average over several years, not at zero. The mid-cycle EBITDA guide takes the next step, from a filed year to earnings at normal spreads.
- What a bad year cost in cash. Read operating cash flow, which carries closure payments in the year they are made, whichever year they were charged. The restructuring note in the annual report shows how much of each programme has been paid and how much is still owed.
- Comparing producers. Hold one basis. Either rebuild every company’s EBITDA before adjustments, as in the first table, or apply one list of exclusions to all of them. Reading where a producer sits in the cycle from spreads and utilisation, as the cycle guide does, avoids the choice altogether.
Commodity Chemicals Sector Primer
The adjusted figure is where normalising starts. The primer rebuilds EBITDA from capacity, utilisation and spread, then values three illustrative producers from trough to mid-cycle by DCF.
- 15 sections, from how a spread business earns to a year-by-year reversion DCF and leverage on mid-cycle EBITDA
- 42 pages
- an ethane-advantaged polyethylene producer, a methanol producer and a chlor-alkali and PVC producer
- 3 producer engines
- listed producers across the ethylene, vinyl, methanol and acetyls chains on filed FY2025 figures
- 6-company screen
The Excel model is the primer's cycle-normalisation valuation live across 12 sheets: three producer tabs (ethane-advantaged polyethylene, methanol, and chlor-alkali and PVC), each reverting its spread and utilisation from trough to mid-cycle through a ten-year free-cash-flow schedule with working capital and sustaining capex; a valuation summary setting each DCF beside the through-cycle multiple screen; cycle scenarios, a cost-curve position, a leverage screen on mid-cycle EBITDA and two live sensitivity grids. Change the spread, the WACC or the exit multiple and the value moves.
See what's in the Commodity Chemicals Sector Primer →£25 PDF · £59 with the Excel model · £159 for all three Chemicals industries
Frequently Asked Questions
- What is the difference between reported and adjusted EBITDA?
- Reported EBITDA is net income with interest, tax, depreciation and amortisation added back, all taken from the audited accounts. Adjusted EBITDA then removes items management treats as outside the running business, mainly impairments, plant closures, restructuring and gains or losses on disposals. No accounting standard defines either figure, so each company publishes its own reconciliation in its earnings release. Across six commodity chemical producers in FY2025, adjusted EBITDA ran from $35M below the reported figure, at Methanex, to $2,220M above it, at Dow.
- What does Dow's Operating EBITDA exclude?
- Dow defines Operating EBITDA as income before taxes, before interest, depreciation and amortisation, excluding significant items. In FY2025 the significant items came to $2,220M before tax: $966M for restructuring programmes and their implementation, a $690M goodwill impairment in polyurethanes and construction chemicals, $303M of asset charges in Latin America and a $323M pension settlement, less a $213M gain on disposals, with $151M of smaller items making up the rest. Operating EBITDA was $3,256M; the same formula without the exclusions gives $1,036M.
- What are identified items in EBITDA?
- It is the term LyondellBasell and Westlake use for what they remove. LyondellBasell's list covers inventory write-downs to market value, gains or losses on selling a business, asset write-downs above $10M in aggregate for the period, its Cash Improvement Plan, site closures, costs of a planned European sale and discontinued operations. Its FY2025 identified items were $1,417M at the EBITDA line, $1,251M of them write-downs. Westlake's were $1,392M: a $727M goodwill write-off and $665M of shutdown and restructuring costs.
Read next
Mid-Cycle EBITDA for Commodity Chemicals
Why LTM fails at cycle extremes; company frameworks from Dow, Olin, MEOH, LYB; ~6-9x EV/EBITDA on normalised earnings; leverage on mid-cycle EBITDA.
Reading the Petrochemical Cycle
Spread mean-reversion, utilisation as early warning, trough language across the peer set, and why normalised prices differ from spot prints.
GAAP vs Adjusted Operating Margin in Medtech
What device makers leave out of adjusted operating margin: amortisation from past deals, restructuring, litigation and share-based pay, how six filers define adjusted, and which margin a DCF should carry.
See it applied
These company profiles apply the concepts from this guide to real public companies.