Chemicals · Commodity Chemicals
Ethylene and Polyethylene Spreads
Cracker margin vs integrated PE margin vs colloquial spread; NA PE margin $580/t in 2025 vs $830/t history; converting ¢/lb to $/t.
Selborne Research · Commodity Chemicals coverage: 7 guides, 6 company profiles, a primer and Excel model
Educational analysis for professional use. This guide is not investment advice or a recommendation to buy or sell any security, and it is not personalised.
On this page
Three Different “Spreads” Get Conflated
“Ethylene spread” means different things to different analysts, and a model of Dow, LyondellBasell or Westlake needs all three kept apart:
- Ethane-to-ethylene cracker cash margin: what a cracker sells (ethylene plus co-products) less its feedstock and variable costs, usually quoted in ¢/lb.
- Ethylene price: the selling price of the molecule itself, also quoted in ¢/lb on the US Gulf Coast.
- Integrated North American polyethylene (PE) chain margin: the net selling price of PE, the most common plastic, less feedstock and variable costs all the way from ethane through ethylene to PE, quoted in $/t.
The casual “product minus feedstock” shortcut ignores yields and co-products, and mixing the three layers is an easy error in a screen.
Cracker Margin: Use a Long-Run Figure
The cracker margin is the first number for a US Gulf Coast producer running ethane. The Excel model that comes with the Selborne primer uses 12¢/lb over the long run, a cautious figure below the ~15¢/lb long-term average cited by RBN Energy, an industry research firm.
Market margins can run well above that when supply is tight, then fall back. A valuation anchored on one strong year carries that year into every later year. The ethane vs naphtha guide explains why US ethane crackers sit low on the global cost curve when gas is cheap against oil.
Integrated PE Margin: The Chain Number
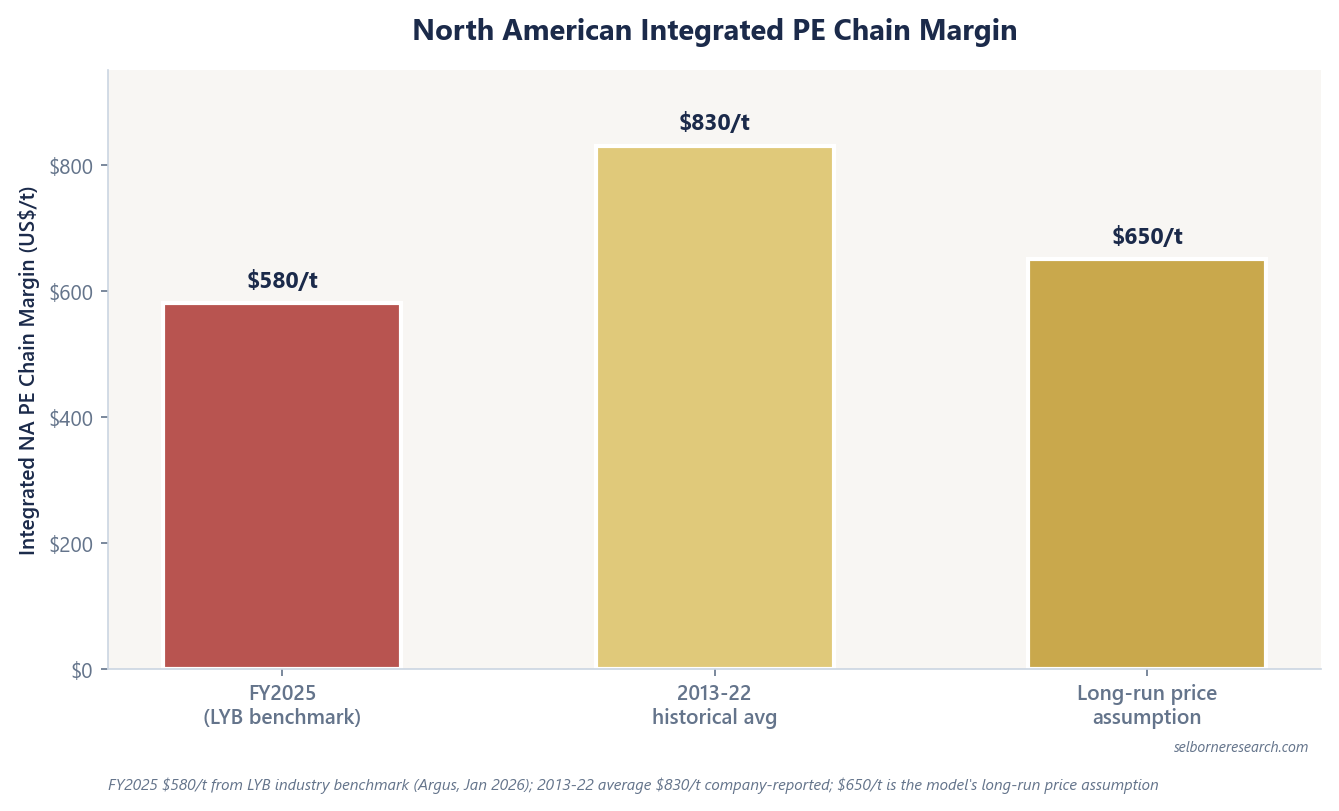
The integrated margin captures the whole chain from feedstock to polymer. LyondellBasell’s earnings slides carry the industry series from Chemical Market Analytics (CMA), the clearest published read of the downturn:
| Measure | Integrated North American PE margin ($/t) | Source |
|---|---|---|
| 2025 | $580 | CMA data in LyondellBasell Q4 2025 earnings slides |
| 2024 | $750 | Same |
| 2013-22 average | $830 | Same |
| Long-run price assumption | $650 | Model input, between 2025 and the historical average |
The 2025 margin sat 30% below the 2013-22 average. LyondellBasell’s headline figure, about 45% below historical averages, covers industry margins across all its businesses, some of which fell further than North American PE. The model’s figure sits between the two on purpose, as a normal year.
The Model’s Long-Run Price Assumptions
Every commodity chemicals guide on this site and the Excel model use the same long-run prices. They are teaching inputs for a normal year’s earnings, not forecasts; check market prices when you build your own model.
Methanol carries two prices because producers sell well below the list prices they post: Methanex’s FY2025 average realised price was $361/t. Only the realised price feeds a valuation; the posted reference is there for comparison.
| Product / margin | Long-run price assumption |
|---|---|
| US ethane (Mont Belvieu, the Texas gas-liquids hub) | 25¢/gal |
| US ethylene (US Gulf Coast) | 30¢/lb |
| US high-density polyethylene (HDPE, Gulf) | 50¢/lb |
| Ethane-to-ethylene cash margin | 12¢/lb |
| Integrated North American PE chain margin | $650/t |
| Naphtha (Asia) | $680/t |
| Methanol, US Gulf posted reference | $490/t |
| Methanol, realised producer price | $380/t |
| PVC, US pipe grade | 54¢/lb |
| US natural gas (Henry Hub benchmark) | $3.00 per million British thermal units (MMBtu) |
Worked Example: Putting the Chain in One Unit
The chain mixes units, so convert before comparing. One cent per pound is $22.05 per tonne (2,204.6 lb in a tonne, 100 cents in a dollar).
| Figure | Quoted | In $/t |
|---|---|---|
| Ethane-to-ethylene cash margin | 12¢/lb | ~$265/t |
| US ethylene | 30¢/lb | ~$661/t |
| US HDPE | 50¢/lb | ~$1,102/t |
| Integrated North American PE chain margin | $650/t | $650/t |
The $650/t chain margin runs from ethane to finished polyethylene, so the cracker’s share is already inside it; do not add the $265/t cracker margin on top. Set against the $1,102/t HDPE price, it means about $452/t went on ethane and the chain’s variable costs. Plant running costs and overhead come out of the $650/t next, which is where the mid-cycle EBITDA guide picks up the arithmetic for a whole producer.
Commodity Chemicals Sector Primer
Three hypothetical producers, in polyethylene, methanol and PVC, valued year by year as spreads recover from the trough, set beside the through-cycle multiple screen.
- 15 sections, from how a spread business earns to a year-by-year reversion DCF and leverage on mid-cycle EBITDA
- 42 pages
- an ethane-advantaged polyethylene producer, a methanol producer and a chlor-alkali and PVC producer
- 3 producer engines
- listed producers across the ethylene, vinyl, methanol and acetyls chains on filed FY2025 figures
- 6-company screen
The Excel model is the primer's cycle-normalisation valuation live across 12 sheets: three producer tabs (ethane-advantaged polyethylene, methanol, and chlor-alkali and PVC), each reverting its spread and utilisation from trough to mid-cycle through a ten-year free-cash-flow schedule with working capital and sustaining capex; a valuation summary setting each DCF beside the through-cycle multiple screen; cycle scenarios, a cost-curve position, a leverage screen on mid-cycle EBITDA and two live sensitivity grids. Change the spread, the WACC or the exit multiple and the value moves.
See what's in the Commodity Chemicals Sector Primer →£25 PDF · £59 with the Excel model · £159 for all three Chemicals industries
Frequently Asked Questions
- What is the ethylene-polyethylene spread?
- In casual use, product price minus feedstock cost. Models separate three layers: the ethane-to-ethylene cracker cash margin (olefin and co-product sales less feedstock and variable costs), the ethylene price itself, and the integrated North American polyethylene (PE) chain margin (net PE selling price less feedstock and variable costs all the way from ethane through ethylene to PE). Mixing them up produces valuation errors.
- What was the North American integrated PE margin in 2025?
- Chemical Market Analytics (CMA) data in LyondellBasell's Q4 2025 earnings slides put the North American integrated PE chain margin at $580/t in 2025, against $750/t in 2024 and a $830/t average for 2013-22. That is 30% below the historical average. The ~45% figure LyondellBasell also quoted is a different measure, covering industry margins across all its businesses.
- What cracker margin does the Selborne model assume for the long run?
- The Excel model that comes with the Selborne primer uses a 12¢/lb ethane-to-ethylene cash margin (US Gulf Coast steam cracker, typical yields), a cautious figure below the ~15¢/lb long-term average cited by RBN Energy, an industry research firm. Market margins run well above that when supply is tight and fall back when spreads return towards their average, so a valuation built on one year's margin inherits that year's place in the cycle.
- How do cracker margin and integrated PE margin differ in units?
- US cracker margins are usually quoted in ¢/lb and integrated PE chain margins in $/t. One cent per pound is $22.05 per tonne, so a 12¢/lb cracker margin is about $265/t and a 50¢/lb price for high-density polyethylene (HDPE) about $1,102/t. Keep each figure in its own unit in a model and convert only when two have to be compared.
Read next
Ethane vs Naphtha: Feedstock Advantage
Ethane yields 80-84% ethylene vs naphtha 29-34%; US ~78% ethane feedslate; why USGC sits low on the global curve and naphtha units idle first.
Mid-Cycle EBITDA for Commodity Chemicals
Why LTM fails at cycle extremes; company frameworks from Dow, Olin, MEOH, LYB; ~6-9x EV/EBITDA on normalised earnings; leverage on mid-cycle EBITDA.
Reading the Petrochemical Cycle
Spread mean-reversion, utilisation as early warning, trough language across the peer set, and why normalised prices differ from spot prints.
See it applied
These company profiles apply the concepts from this guide to real public companies.