Chemicals · Commodity Chemicals
Ethane vs Naphtha: Feedstock Advantage
Ethane turns 80-84% of its weight into ethylene, naphtha 29-34%. Why US Gulf Coast crackers sit low on the global cost curve and naphtha units idle first.
Selborne Research · Commodity Chemicals coverage: 7 guides, 6 company profiles, a primer and Excel model
Educational analysis for professional use. This guide is not investment advice or a recommendation to buy or sell any security, and it is not personalised.
On this page
Feedstock Sets Cost-Curve Position
An ethylene producer’s cost starts with what it feeds the cracker, the furnace that breaks hydrocarbons into ethylene. Light feeds such as ethane and propane, both natural-gas liquids, give high ethylene yields. Heavy feeds such as naphtha and gas oil, both refinery fractions, give less ethylene but more co-products (propylene, butadiene, aromatics) to sell.
High yields on a cheap gas-linked feed put US Gulf Coast crackers on ethane low on the global cost curve, the ranking of the world’s plants from cheapest to dearest per tonne. So work on Dow, LyondellBasell or Westlake starts with the feedstock, not the price of polyethylene (PE), the plastic most ethylene ends up in.
Yield: The Core Mechanism
Ethane turns 80-84% of its weight into ethylene; naphtha turns 29-34% (US Department of Energy, Sep 2022). A naphtha cracker therefore buys about two and a half times the tonnes of feed for the same ethylene. The steam cracker yields guide sets out the full product slate for five feeds. In oversupply, more feed per tonne, bought at oil-linked prices, makes the naphtha units of Europe and Northeast Asia the first to be squeezed.
Naphtha units do earn co-product credits that ethane crackers mostly lack. The US Energy Information Administration (4 Nov 2024) counts those credits, mainly propylene, butadiene, benzene and xylene, and still finds US ethane cracking has historically been more profitable than naphtha cracking.
The US Feedstock Mix Is Light
| Metric | Value | Source |
|---|---|---|
| US ethylene made from ethane | ~78% | DOE, 2019 |
| Dow cracking on light feeds | >80% | Q3 2025 earnings presentation |
| Dow capacity in the Americas, where feed is cheap | ~65% | Q3 2025 earnings presentation |
| Dow cracking among the cheapest quarter of global plants | ~80% | Q3 2025 earnings presentation |
| Westlake production capacity in North America | ~85% | Q4 2025 earnings presentation |
A light feed mix is why company presentations place US producers below Europe and Asia on cost per tonne of ethylene.
One Company, Both Sides of the Atlantic
LyondellBasell runs both feeds:
| Region | Feedstock | FY2025 pressure |
|---|---|---|
| Americas | Ethane and other natural-gas liquids | Margins hit by higher gas-liquid costs, but still cheaper than naphtha |
| Europe | Naphtha | Among the dearest plants, so squeezed first in oversupply |
Management put 2025 industry margins across its businesses about 45% below their 2013-22 averages. The same downturn lands harder on the European plants because they sit higher on the curve.
Cracker Margin: Where the Advantage Shows
The feedstock edge becomes cash at the cracker, as the ethane-to-ethylene margin. The Excel model that comes with the Selborne primer assumes 12¢/lb over the long run. That is a cautious figure, below the ~15¢/lb long-term average cited by RBN Energy, an industry research firm.
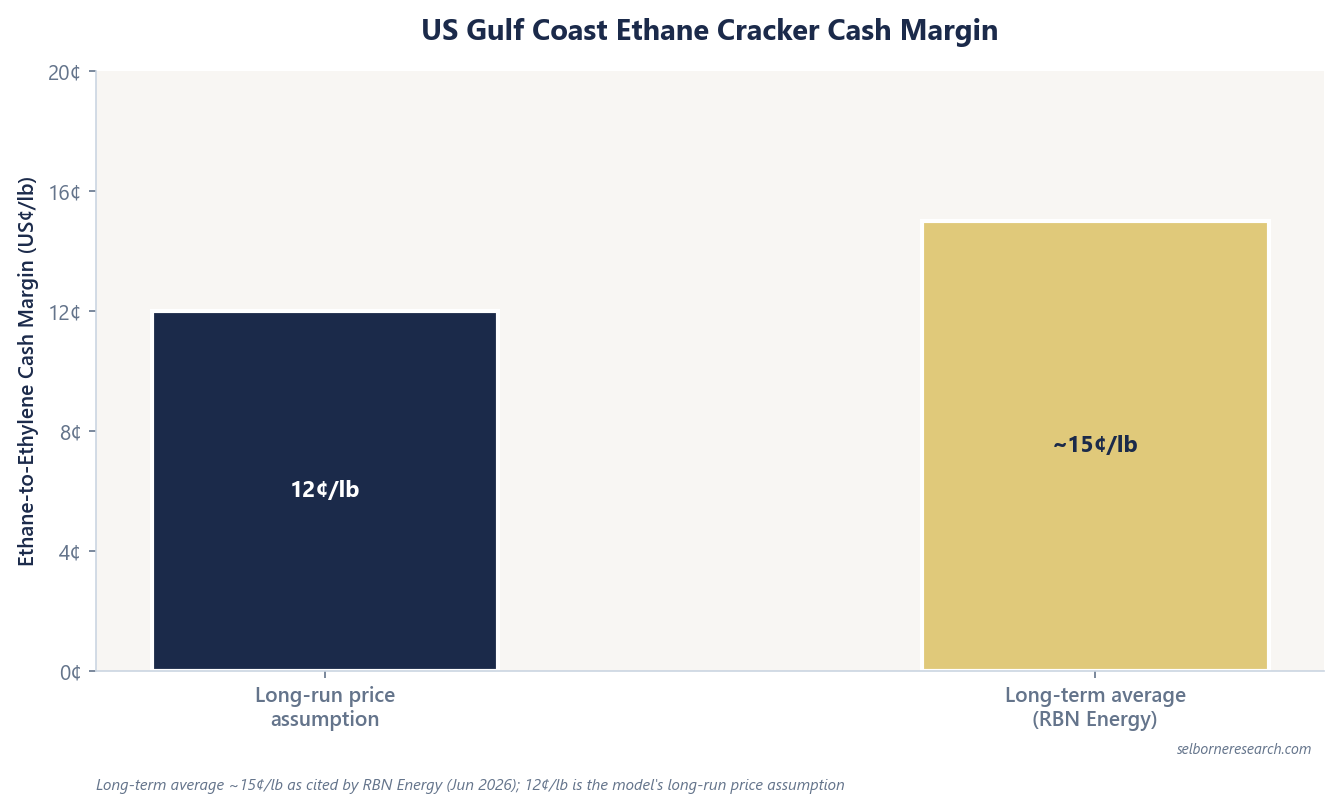
Market margins swing above and below the long-run figure through the cycle, and a valuation should not rest on a short-lived spike. The ethylene and PE spreads guide separates the cracker margin from the integrated PE chain margin and lists the model’s long-run prices.
Ethane Follows Gas, Naphtha Follows Oil
Ethane is priced off US natural gas and naphtha off crude oil, so the gas-to-oil price ratio moves producers along the petrochemical cost curve. Cheap gas against oil widens the ethane cracker’s edge; oil falling faster than gas narrows it.
Who Idles First in a Downturn
The sequence in an oversupply:
- Spreads compress. The North American integrated PE margin fell to $580/t in 2025 against a $830/t 2013-22 average, in Chemical Market Analytics data LyondellBasell reported.
- Operating rates fall. LyondellBasell’s Americas olefins and polyolefins plants ran at ~75% in 4Q25 (crackers ~90%), intermediates and derivatives ~75%.
- High-cost naphtha crackers in Europe and Northeast Asia cut rates or shut.
- US ethane crackers keep running but earn less. Dow’s FY2025 Operating EBITDA of $3,256M fell below the <$6B trough line it drew at its 2024 Investor Day.
Other chains followed the same pattern. Westlake described “global overcapacity in certain PEM materials” (its performance and essential materials segment), and its adjusted EBITDA fell 50% year on year. Celanese idled its Frankfurt vinyl acetate monomer plant, curtailed Singapore and ran its lowest-cost Gulf Coast plants first.
Commodity Chemicals Sector Primer
Three hypothetical producers, in polyethylene, methanol and PVC, valued year by year as spreads recover from the trough, set beside the through-cycle multiple screen.
- 15 sections, from how a spread business earns to a year-by-year reversion DCF and leverage on mid-cycle EBITDA
- 42 pages
- an ethane-advantaged polyethylene producer, a methanol producer and a chlor-alkali and PVC producer
- 3 producer engines
- listed producers across the ethylene, vinyl, methanol and acetyls chains on filed FY2025 figures
- 6-company screen
The Excel model is the primer's cycle-normalisation valuation live across 12 sheets: three producer tabs (ethane-advantaged polyethylene, methanol, and chlor-alkali and PVC), each reverting its spread and utilisation from trough to mid-cycle through a ten-year free-cash-flow schedule with working capital and sustaining capex; a valuation summary setting each DCF beside the through-cycle multiple screen; cycle scenarios, a cost-curve position, a leverage screen on mid-cycle EBITDA and two live sensitivity grids. Change the spread, the WACC or the exit multiple and the value moves.
See what's in the Commodity Chemicals Sector Primer →£25 PDF · £59 with the Excel model · £159 for all three Chemicals industries
Frequently Asked Questions
- Why is ethane cheaper than naphtha for ethylene production?
- Ethane turns 80-84% of its weight into ethylene in a steam cracker, against 29-34% for naphtha (US Department of Energy, Sep 2022). Ethane is a natural-gas liquid, so US shale gas keeps it cheap relative to naphtha, which is priced off crude oil. A US Gulf Coast cracker on ethane therefore makes far more ethylene per dollar of feedstock. The US Energy Information Administration (Nov 2024) notes that US ethane cracking has historically earned higher margins than naphtha cracking, even after counting the co-product credits that heavier feeds earn.
- How much US ethylene is made from ethane?
- About 78% of US ethylene was made from ethane in 2019 (US Department of Energy, Sep 2022). Dow reports more than 80% light-feed cracking. Westlake cracks ethane at Lake Charles and Calvert City and has about 85% of its production capacity in North America, where it cites energy and feedstock advantages. Europe and Northeast Asia crack mostly naphtha.
- Who idles crackers first in a global oversupply?
- Naphtha crackers in Europe and Northeast Asia sit high on the ethylene cost curve. When spreads compress and demand falls, they cut rates before US Gulf Coast ethane units. LyondellBasell runs ethane and other gas liquids in the Americas and naphtha in Europe, so one company feels both sides. Its 4Q25 operating rates: Olefins and Polyolefins Americas ~75% (crackers ~90%), Intermediates and Derivatives ~75%.
- What ethane cracker margin does the Selborne model assume?
- The Excel model that comes with the Selborne primer assumes a 12¢/lb ethane-to-ethylene cash margin over the long run, a cautious figure below the ~15¢/lb long-term average cited by RBN Energy, an industry research firm. Valuations use a long-run margin because spreads return towards their average. Its integrated polyethylene (PE) chain margin assumption is $650/t, against the $580/t North American industry margin LyondellBasell reported for 2025.
Read next
Ethylene and Polyethylene Spreads
Cracker margin vs integrated PE margin vs colloquial spread; FY2025 NA PE at $580/t vs $830/t history; illustrative ethane cracker margin 12¢/lb.
Chemical Industry Cost Curves
Feedstock as the primary axis of the ethylene cost curve; oil-vs-gas shifts; naphtha co-products; marginal producers idle first in downturns.
Steam Cracker Yields by Feedstock
Five cracker feeds ranked by ethylene yield, from ethane to gas oil: tonnes of feed per tonne of ethylene, and the co-products that grow as the feed gets heavier.
See it applied
These company profiles apply the concepts from this guide to real public companies.