Healthcare · Medtech
GAAP vs Adjusted Operating Margin in Medtech
Six device makers added 5 to 10 points to FY2025 operating margin by adjusting. What they exclude, why past deals explain most of it, and what a DCF should use.
Selborne Research · Medtech coverage: 7 guides, 6 company profiles, a primer and Excel model
Educational analysis for professional use. This guide is not investment advice or a recommendation to buy or sell any security, and it is not personalised.
On this page
Most of the Gap Is the Cost of Past Deals
Six large device makers reported FY2025 adjusted operating margins 5.0 to 10.0 points above their GAAP figures. At the four that have grown by acquisition, between 69% and 77% of what each added back was accounting left behind by past deals, mostly amortisation of the patents and product rights they bought. At the two that grew mainly on their own products, the gap came from somewhere else: share-based pay at Intuitive Surgical and a litigation charge at Edwards Lifesciences. One word, “adjusted”, covers both.
GAAP operating margin is operating income as the audited accounts report it, divided by revenue. The adjusted figure starts from the same number and adds back charges management treats as outside the running business. Each company publishes the bridge between the two in the non-GAAP reconciliation at the back of its quarterly earnings release, filed with the SEC as exhibit 99.1 to a Form 8-K. Read that table rather than the headline. The adjusted margin on its own says nothing about what went into it.
FY2025 Operating Margins, GAAP and Adjusted
| Company | GAAP operating margin | Adjusted operating margin | Gap (points) | Largest add-back | The company’s label |
|---|---|---|---|---|---|
| Boston Scientific | 18.0% | 28.0% | 10.0 | Amortisation | Adjusted |
| Intuitive Surgical | 29.3% | 37.4% | 8.1 | Share-based pay | Non-GAAP |
| Medtronic | 17.8% | 25.7% | 7.9 | Amortisation | Non-GAAP |
| Stryker | 19.5% | 26.3% | 6.8 | Amortisation | Adjusted |
| Edwards Lifesciences | 20.8% | 27.1% | 6.3 | Litigation | Adjusted |
| Abbott | 18.2% | 23.2% | 5.0 | Amortisation | Excluding specified items |
Fiscal years ended 31 December 2025, except Medtronic’s, which ended on 25 April 2025. Each adjusted figure is the company’s own from its FY2025 earnings release, except Abbott’s: it prints no adjusted operating margin, so 23.2% is its GAAP operating earnings plus the specified items its reconciliation lists.
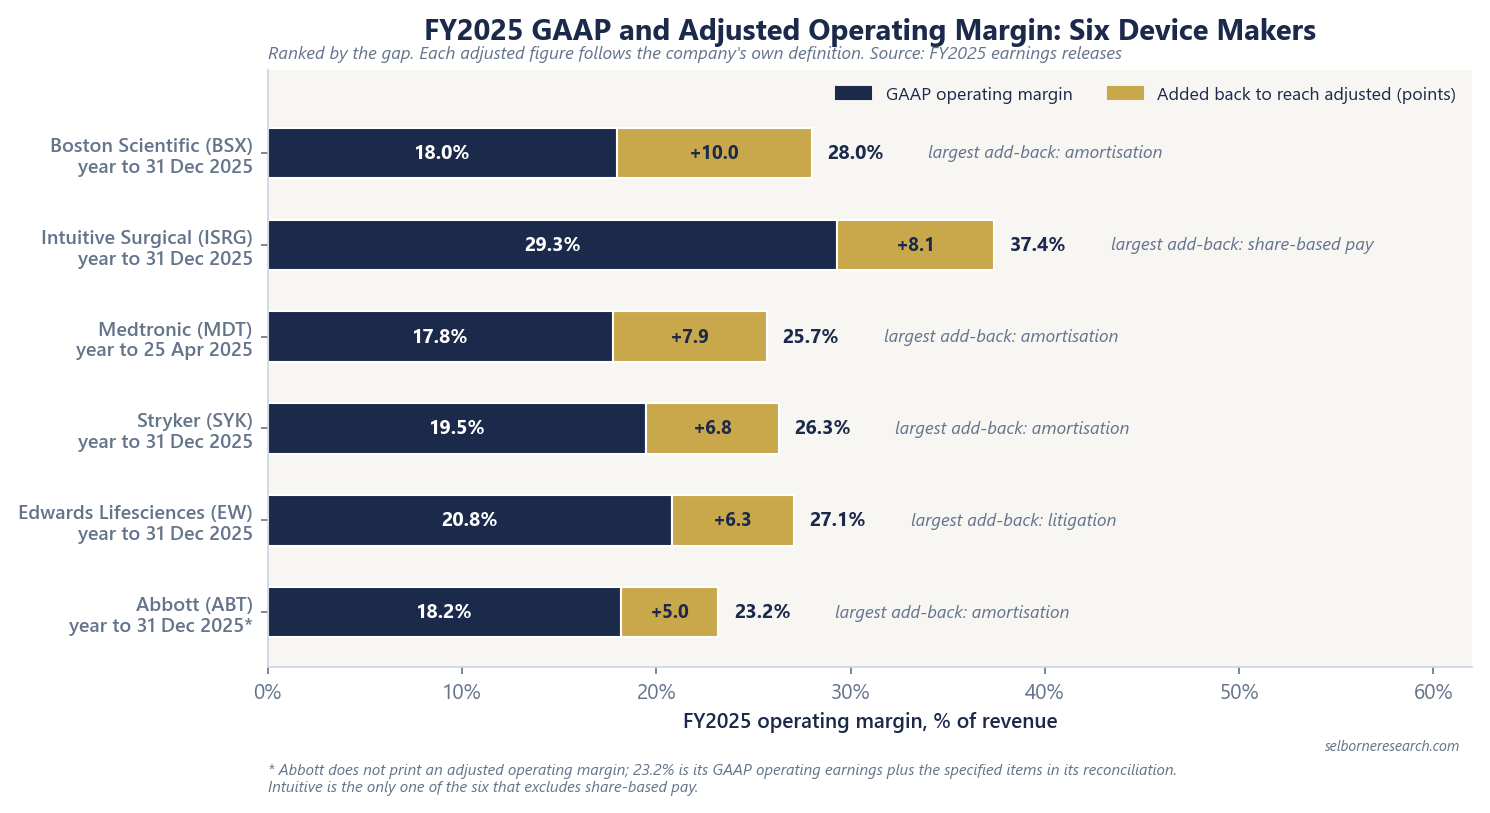
On GAAP, five of the six sit within three points of each other, between 17.8% and 20.8%. Switch to adjusted and the order changes: Boston Scientific moves from fifth to second, and Abbott from fourth to last. Nothing in either business differs between the two columns. Only the list of exclusions does, which is why a table comparing companies has to use one basis throughout.
What Each Company Adds Back
| $M, FY2025 | Total added back | Amortisation of acquired intangibles | Other deal costs | Restructuring | Litigation | Share-based pay | Other |
|---|---|---|---|---|---|---|---|
| Medtronic | 2,693 | 1,807 | 124 | 303 | 317 | – | 142 |
| Abbott | 2,248 | 1,682 | 57 | 284 | in other | – | 225 |
| Intuitive Surgical | 814.9 | 13.2 | – | – | 13.6 | 789.1 | -1.0 |
| Stryker | 1,714 | 732 | 508 | 191 | 75 | – | 208 |
| Boston Scientific | 1,999 | 897 | 473 | 343 | 194 | – | 92 |
| Edwards Lifesciences | 379.3 | 7.3 | -10.8 | 17.4 | 325.4 | – | 40.0 |
Columns group the lines in each company’s own reconciliation. Other deal costs covers integration spending, acquired inventory revalued to fair value, earn-out revaluations and deal-related charges; Stryker’s includes $140M of stock payments triggered by a change in control, and its litigation column includes $58M of recall costs. Other covers impairments, EU device-regulation compliance costs and, at Medtronic, $90M it adds back to sales; Abbott’s other includes a legal reserve. Intuitive’s share-based pay column includes $1.0M of long-term incentive plan expense beside the $788.1M of share-based compensation, and its other is a small gain on a business sale. Edwards’ restructuring includes separation costs.
Amortisation is the largest single item. It was $5,139M of the $9,848M the six added back between them, 52%. When a company buys another, it books the target’s patents, product rights and customer relationships as intangible assets and writes them off over their useful lives. The charge accounts for a real purchase, but no cash leaves in the year it is booked; the cash went out when the deal closed. That is the case for excluding it, and it explains the pattern in the table. Medtronic, Abbott, Stryker and Boston Scientific each carried $732M to $1,807M of it. Intuitive and Edwards carried under $15M each.
Deal costs sit beside it. Add them to amortisation, and acquisitions account for 69% to 77% of the gap at each of the four acquirers.
Restructuring recurs. All four acquirers excluded restructuring in both FY2024 and FY2025: Medtronic $389M then $303M, Boston Scientific $229M then $343M. A charge that turns up every year is a running cost.
Litigation is lumpy. Edwards booked $325.4M of intellectual-property agreement and litigation expense, 86% of its FY2025 gap. That single charge is why a company with almost no amortisation still shows 6.3 points between its two margins.
Share-based pay separates Intuitive from the rest. It excluded $788.1M, 7.8% of revenue and 97% of its gap. None of the other five adjusts for ordinary share-based pay. Leave it in, as they do, and Intuitive’s margin is 29.5%, barely above its GAAP 29.3%.
Six Companies, Six Definitions of Adjusted
No accounting standard sits behind “adjusted”, so each company’s figure answers a slightly different question. The FY2025 releases differ in five ways worth checking before any comparison.
- Share-based pay. Excluded at Intuitive only. Stryker’s $140M of stock paid on a change in control sits inside its acquisition costs, a deal cost rather than ordinary pay.
- The label. Stryker, Boston Scientific and Edwards say adjusted, Medtronic and Intuitive say non-GAAP, and Abbott says excluding specified items. The name tells you nothing about the contents.
- Whether a margin is printed at all. Abbott reconciles gross margin, R&D and SG&A line by line but prints no adjusted operating margin, so you build it.
- The revenue line. Medtronic’s non-GAAP margin divides by $33,627M of net sales, $90M above GAAP, because it adds back accruals for Italy’s payback scheme, under which device suppliers refund part of regional health-budget overruns, booked after two 2024 rulings by Italy’s Constitutional Court.
- Where amortisation was charged. This matters at gross margin, where Abbott charges it above the gross line and Medtronic, Stryker and Boston Scientific below it, as the gross margin guide shows. By operating income every company has charged it, so GAAP operating margin puts all six on one set of rules.
Which Margin Belongs in a DCF
Neither printed margin goes into a DCF unchanged. The adjusted figure is the better start for the trend in the running business. The work is putting back what recurs, and keeping the deal spending consistent with the growth you forecast.
Take a fictional acquisitive device maker with $10,000M of revenue and $1,800M of GAAP operating income.
| Item | $M | Margin | In a DCF |
|---|---|---|---|
| GAAP operating income | 1,800 | 18.0% | The audited starting point |
| Add back amortisation of acquired intangibles | 500 | Add back: non-cash, and the deal is already paid for | |
| Add back deal and integration costs | 50 | Add back only if the forecast has no further deals | |
| Add back restructuring | 150 | Keep as a cost if it recurs | |
| Adjusted operating income, as the company reports it | 2,500 | 25.0% | |
| Operating income for the DCF | 2,350 | 23.5% | Adjusted, less recurring restructuring |
The amortisation add-back holds only if acquisitions stay out of the forecast growth as well. A forecast that grows revenue at the organic rate and excludes amortisation is consistent with itself. One that uses reported growth, which includes bought revenue, also has to charge the cash paid for those deals, as a recurring outflow like capital spending. Taking the bought growth without its cost counts the acquisitions as free. The organic growth guide shows how to separate the two.
Restructuring and litigation that recur go back in at a normal level: an average over several years, not the latest year and not zero.
Share-based pay stays a cost. If you start from a margin that excludes it, carry it through the share count instead, as the dilution it causes. Otherwise the valuation treats the shares handed to staff as free to the owners.
For comparing companies, use GAAP operating margin, or rebuild every company on the same exclusions. A table that mixes definitions compares accounting choices. The same amortisation question decides whether a pharma dividend looks covered, and the pharma payout guide works through it on GAAP earnings.
Choose the margin before building the model. The primer sets GAAP against adjusted figures, then values a razor-blade franchise and a diversified grower by DCF.
- 15 sections, installed base and pull-through to a franchise DCF, the runway a price implies and growth-adjusted P/E
- 44 pages
- a razor-blade franchise and a diversified grower
- 2 worked archetypes
- large-cap device makers on filed organic growth, margins and free cash flow
- 6-company screen
The Excel model is the primer's franchise DCF live across 11 sheets: a razor-blade franchise and a diversified grower valued over 20 years on funded free cash flow, with growth held for a runway and then faded to terminal, an operating margin path and a WACC built from the cost of equity and after-tax debt; a runway table showing how many years of growth the illustrative price pays for; a valuation summary; the installed-base build; P/E implied by the DCF value and by the price, each growth-adjusted; organic-versus-reported checks; and a sensitivity grid. Change organic growth, the runway, ROIC or the WACC and the value moves.
See what's in the Medtech Sector Primer →£25 PDF · £59 with the Excel model · £159 for all three Healthcare industries
Frequently Asked Questions
- What is the difference between GAAP and adjusted operating margin?
- GAAP operating margin is operating income under US accounting rules, divided by revenue. Adjusted operating margin adds back charges the company treats as outside its running business, most often amortisation of acquired intangibles, restructuring, litigation and acquisition costs. No accounting standard defines it, so each company publishes its own reconciliation in its earnings release. At six large device makers in FY2025, the adjusted figure ran 5.0 to 10.0 points above GAAP.
- Why is adjusted operating margin higher at acquisitive medtech companies?
- Because acquisitions leave amortisation behind. A buyer books the target's patents and product rights as intangible assets and writes them off over several years, a non-cash charge that adjusted figures exclude. At Medtronic, Abbott, Stryker and Boston Scientific, amortisation and other deal costs made up 69% to 77% of what each added back in FY2025. Intuitive Surgical and Edwards Lifesciences carry little amortisation, and their gaps came from share-based pay and a litigation charge.
- Which medtech companies exclude stock-based compensation from adjusted operating margin?
- Of six large device makers, only Intuitive Surgical excluded ordinary share-based pay from its FY2025 non-GAAP operating income: $788.1M, or 7.8% of revenue. Medtronic, Abbott, Stryker, Boston Scientific and Edwards Lifesciences did not. Leave that item in and Intuitive's margin is 29.5% rather than 37.4%, so its adjusted figure is built on a different definition from the other five.
- Should a DCF use GAAP or adjusted operating margin?
- Neither as printed. Start from the adjusted margin for the trend in the running business, put restructuring and litigation back at a normal annual level if they recur, and keep share-based pay as a cost or as dilution. Excluding amortisation is consistent only if the forecast also leaves out growth from future acquisitions, or charges the cash those acquisitions cost.
Read next
Organic vs Reported Growth in Medtech
Strip M&A before comparing medtech growth: BSX Urology +4.7% organic vs +23.1% reported, FY2025 organic growth for six peers, and why multiples follow organic growth.
Medtech Gross Margins by Company
Why device gross margin tracks product mix: six filers on one basis, where amortisation sits, a diversified group split by segment, and how operating margin reorders the list.
The Pharma GAAP Payout Trap
Why Pfizer ~126% and AbbVie ~276% GAAP dividend payout ratios mislead: non-cash charges on acquired assets, one-off gains, and how to test pharma dividends against cash.
Reported vs Adjusted EBITDA in Chemicals
What six producers add back to reach adjusted EBITDA, why write-downs and closures dominate a bad year, and which figure answers which question.
See it applied
These company profiles apply the concepts from this guide to real public companies.