Healthcare · Medtech
Razor-and-Blade Economics in Medtech
How capital platforms turn into recurring pull-through: Intuitive's 84% recurring mix, recurring-mix screens and a worked 5,000-system example.
Selborne Research · Medtech coverage: 7 guides, 6 company profiles, a primer and Excel model
Educational analysis for professional use. This guide is not investment advice or a recommendation to buy or sell any security, and it is not personalised.
On this page
The Share of Revenue That Repeats Is the Business Model
In medtech’s razor-and-blade model a placed platform, such as a surgical robot, earns revenue every time a clinician uses it. The question is how much of a company’s revenue repeats without a new capital sale.
Intuitive Surgical is the one large device maker that files the answer: 84% of FY2025 revenue was recurring, earned on 11,106 installed da Vinci robots that ran ~3.15M procedures (+18%). Its large peers file no recurring share. Stryker says only that leases bring in under 4% of its revenue, which shows leasing is small but not how much of the rest repeats.
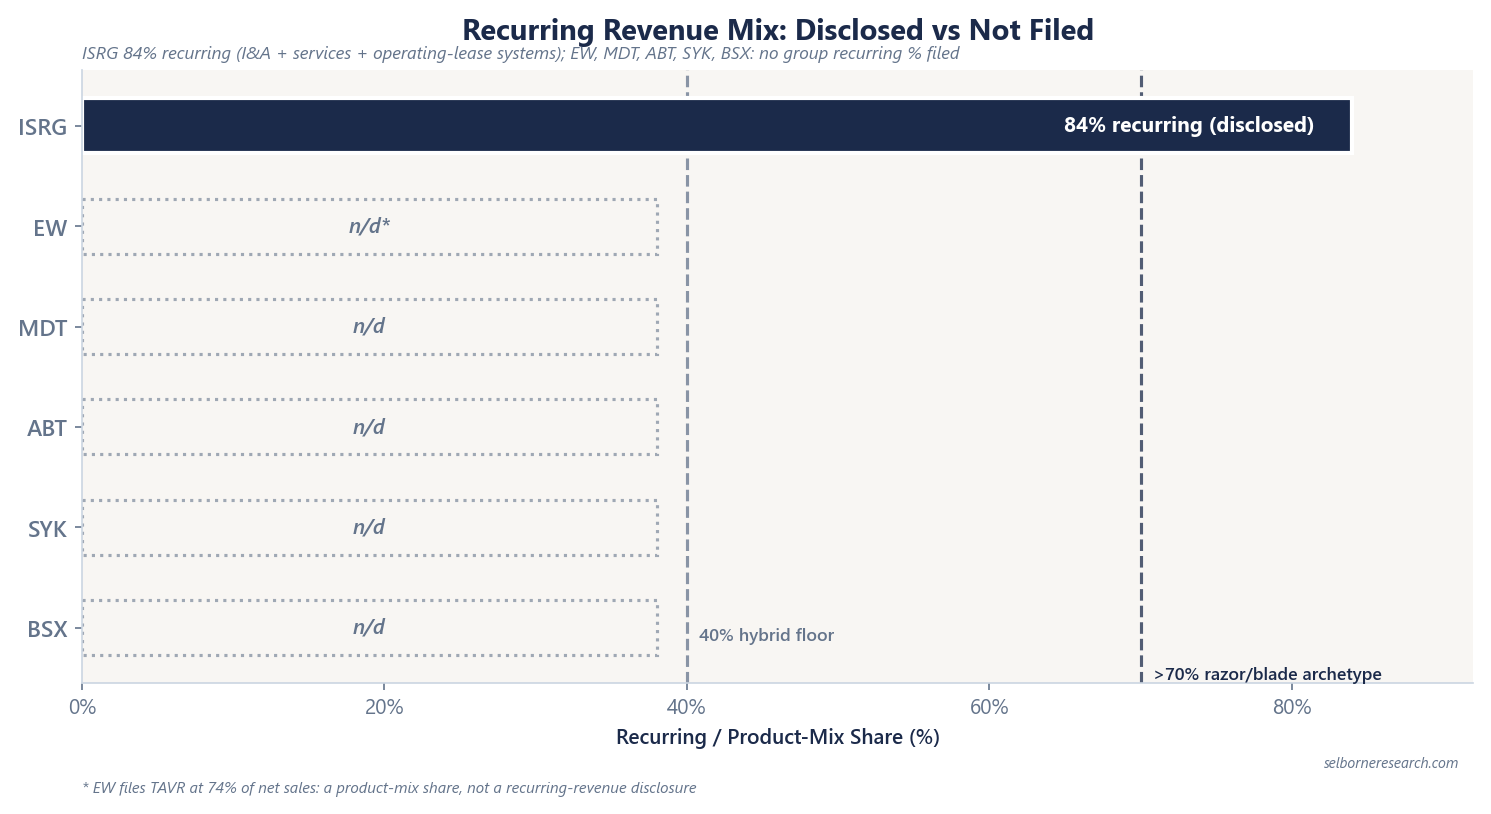
How Intuitive Builds Its 84%
Intuitive counts three lines as recurring: instruments and accessories (I&A), the single-use tools each operation consumes; service contracts; and rent on robots placed under operating leases. The rent is booked inside Systems revenue.
| FY2025, $M | Revenue | Share of total | Recurring? |
|---|---|---|---|
| Instruments & accessories (I&A) | 6,018.9 | 59.8% | Yes |
| Service | 1,572.1 | 15.6% | Yes |
| Systems: operating-lease revenue | 874.3 | 8.7% | Yes |
| Systems: sold, or on sales-type leases | 1,599.4 | 15.9% | No |
| Total revenue | 10,064.7 | 100% | |
| Recurring revenue | 8,465.3 | 84.1% | Filed as 84% |
Source: Intuitive Surgical FY2025 10-K. The two Systems rows make up Systems revenue of $2,473.7M (24.6%).
So 84% is not a consumables ratio: about a tenth of it is robot rent, $530.9M of it charged per use.
I&A grew 19%. Intuitive puts that down to ~18% more da Vinci procedures and ~51% more on Ion, its robot for lung biopsies. Pull-through, the I&A revenue each da Vinci procedure brings in, was $1,810, flat on the year, so the growth came from volume. It counts da Vinci only: 3.15M × $1,810 ≈ $5.7B, and most of the other $0.3B of I&A is instruments for Ion.
Recurring-Mix Screen
| Band | Recurring share | What it describes |
|---|---|---|
| Razor/blade archetype | >70% | Most revenue repeats from the installed base; Intuitive’s 84% is the filed example |
| Hybrid | 40–70% | Capital sales and recurring revenue of similar weight |
| Capital-cycle | <40% | Revenue follows hospital equipment budgets |
A company that files no recurring share cannot be placed, and Intuitive’s 84% says nothing about a diversified portfolio.
What Peers Actually File
| Company | Recurring or pull-through signal | FY2025 revenue | Gross margin (GAAP) |
|---|---|---|---|
| Intuitive Surgical | 84% recurring; I&A 59.8% | $10.1B (+21%) | 66.0% |
| Stryker | No group %; lease revenue <4% | $25.1B (10.3% organic) | 64.0% |
| Abbott | Libre >8M users; no group % | $44.3B (5.5% organic) | 52.6% (56.4% before amortisation) |
| Edwards Lifesciences | TAVR 74% of sales; no recurring % | $6.1B (+10.7% CC) | 78.0% |
Libre is Abbott’s continuous glucose monitor, a wearable sensor that users replace on a cycle. TAVR (transcatheter aortic valve replacement) is a heart valve fitted by catheter rather than open surgery. CC is constant currency: growth with exchange-rate moves taken out.
Edwards’ 74% is the share of sales from one product, a measure of concentration.
Worked Example: A 5,000-System Platform
A fictional platform, with pull-through a little below Intuitive’s:
| Input | Value |
|---|---|
| Installed systems | 5,000 |
| Annual procedures | 250,000, growing 12% a year |
| I&A pull-through | $1,750/procedure |
| Recurring revenue share | 72% |
| Gross margin | 68% |
Step 1, utilisation: 250,000 ÷ 5,000 = 50 procedures per system a year, against about 284 per da Vinci robot at Intuitive (3.15M ÷ 11,106). The robots are lightly used, so existing ones can supply much of the growth.
Step 2, I&A revenue: 250,000 × $1,750 = $437.5M
Step 3 treats I&A as the whole recurring stream. For a real company, which also counts service and lease income, divide I&A by its own share of sales (Intuitive: 59.8%), not the recurring share (84%), or revenue comes out too low.
Step 3, total revenue: $437.5M ÷ 0.72 ≈ $607.6M
Step 4, gross profit at 68%: $607.6M × 68% ≈ $413.2M
Once a robot is installed, growth comes from more procedures on it, with no new capital sale needed. A platform at 72% recurring with 12% procedure growth is a different business from a diversified portfolio growing 4.9% organically (Medtronic, FY2025), so pair recurring mix with organic growth before comparing multiples.
What the Filings Cannot Show
Gross-margin spreads between consumables and capital equipment (figures such as “60–75% consumables vs 30–50% capital”) are not in FY2025 filings. Peer margin work stays at GAAP gross profit.
The Intuitive Surgical profile has filed pull-through on a live platform; Stryker is an orthopaedic robot (>2.0M cumulative Mako procedures) with no disclosed recurring share.
A franchise DCF charges reinvestment for every point of growth, fades that growth year by year, and asks how many years of it a price pays for.
- 15 sections, installed base and pull-through to a franchise DCF, the runway a price implies and growth-adjusted P/E
- 44 pages
- a razor-blade franchise and a diversified grower
- 2 worked archetypes
- large-cap device makers on filed organic growth, margins and free cash flow
- 6-company screen
The Excel model is the primer's franchise DCF live across 11 sheets: a razor-blade franchise and a diversified grower valued over 20 years on funded free cash flow, with growth held for a runway and then faded to terminal, an operating margin path and a WACC built from the cost of equity and after-tax debt; a runway table showing how many years of growth the illustrative price pays for; a valuation summary; the installed-base build; P/E implied by the DCF value and by the price, each growth-adjusted; organic-versus-reported checks; and a sensitivity grid. Change organic growth, the runway, ROIC or the WACC and the value moves.
See what's in the Medtech Sector Primer →£25 PDF · £59 with the Excel model · £159 for all three Healthcare industries
Frequently Asked Questions
- What is the razor-and-blade model in medtech?
- A capital platform (robot, pump, imaging system) is placed once; recurring revenue comes from procedure-linked consumables, instruments and accessories (I&A), services, and sometimes operating-lease system revenue. Intuitive Surgical filed 84% recurring revenue in FY2025, with I&A at 59.8% of total revenue and $1,810 pull-through per da Vinci procedure.
- How do you measure recurring revenue in medical devices?
- Definitions differ by filer. Intuitive counts I&A (59.8% of FY2025 revenue), services (15.6%) and operating-lease system revenue (8.7%) as recurring, 84% in all. Most large peers file no consolidated recurring percentage, so analysts use installed-base proxies instead, such as Abbott's Libre glucose-monitor users or Stryker's Mako robot procedures. We treat above 70% recurring as the razor/blade archetype.
- Why does recurring mix affect valuation?
- Revenue that repeats from an installed base is more predictable than one-off capital sales, so it can support growth for longer. In a DCF that shows up as a longer growth runway, not as a multiple added on top; adding both would count the same stickiness twice.
- Can you compare consumables gross margin to capital equipment margin?
- Not from FY2025 filings. No major device maker published a consolidated split of gross margin between consumables and capital equipment in the primary sources we opened. Peer work stays at GAAP gross margin (52.6% to 78.0% across six large filers in FY2025) rather than inventing a consumables spread.
Read next
Installed Base and Pull-Through
Systems, users, and procedures as the medtech demand engine: filed installed-base KPIs for ISRG and ABT Libre, SYK Mako cumulative procedures, and the pull-through arithmetic.
Organic vs Reported Growth in Medtech
Strip M&A before comparing medtech growth: BSX Urology +4.7% organic vs +23.1% reported, FY2025 organic growth for six peers, and why multiples follow organic growth.
Medtech Gross Margins by Company
Why device gross margin tracks product mix: six filers on one basis, where amortisation sits, a diversified group split by segment, and how operating margin reorders the list.
See it applied
These company profiles apply the concepts from this guide to real public companies.