Healthcare · Medtech
Medtech Gross Margins by Company
Gross margin at six large device makers ran from 52.6% to 78.0% in FY2025. Why it tracks product mix, where amortisation sits, and what operating margin adds.
Selborne Research · Medtech coverage: 7 guides, 6 company profiles, a primer and Excel model
Educational analysis for professional use. This guide is not investment advice or a recommendation to buy or sell any security, and it is not personalised.
On this page
Gross Margin Tells You What a Device Maker Sells
Six large listed device makers reported FY2025 gross margins from 52.6% to 78.0%. Most of that spread comes from what each company sells: implants and single-use devices, capital equipment, service contracts, or products outside devices altogether. A table of medtech gross margins is closer to a map of business models than a league table of management.
Gross margin is revenue less the cost of making the products sold, divided by revenue. It leaves out the two costs that weigh most on a device maker: research and development, and the sales force that trains surgeons and supports procedures. Both sit below gross profit, which is why operating margin, later in this guide, puts the six in a different order.
FY2025 Gross Margins, Six Filers
| Company | GAAP gross margin | Adjusted gross margin | Amortisation of acquired intangibles | Fiscal year end |
|---|---|---|---|---|
| Edwards Lifesciences | 78.0% | 78.1% | Inside cost of sales, $7.3M | 31 Dec 2025 |
| Boston Scientific | 69.0% | 70.6% | Below gross profit, $897M | 31 Dec 2025 |
| Intuitive Surgical | 66.0% | 67.6% | Inside cost of revenue, $9.7M | 31 Dec 2025 |
| Medtronic | 65.3% | 65.7% | Below gross margin, $1,807M | 25 Apr 2025 |
| Stryker | 64.0% | 65.3% | Below gross profit, $732M | 31 Dec 2025 |
| Abbott | 52.6% | 56.7% | Inside gross margin, $1,682M | 31 Dec 2025 |
Each figure is the company’s own, from its FY2025 earnings release. Adjusted figures follow each company’s definition.
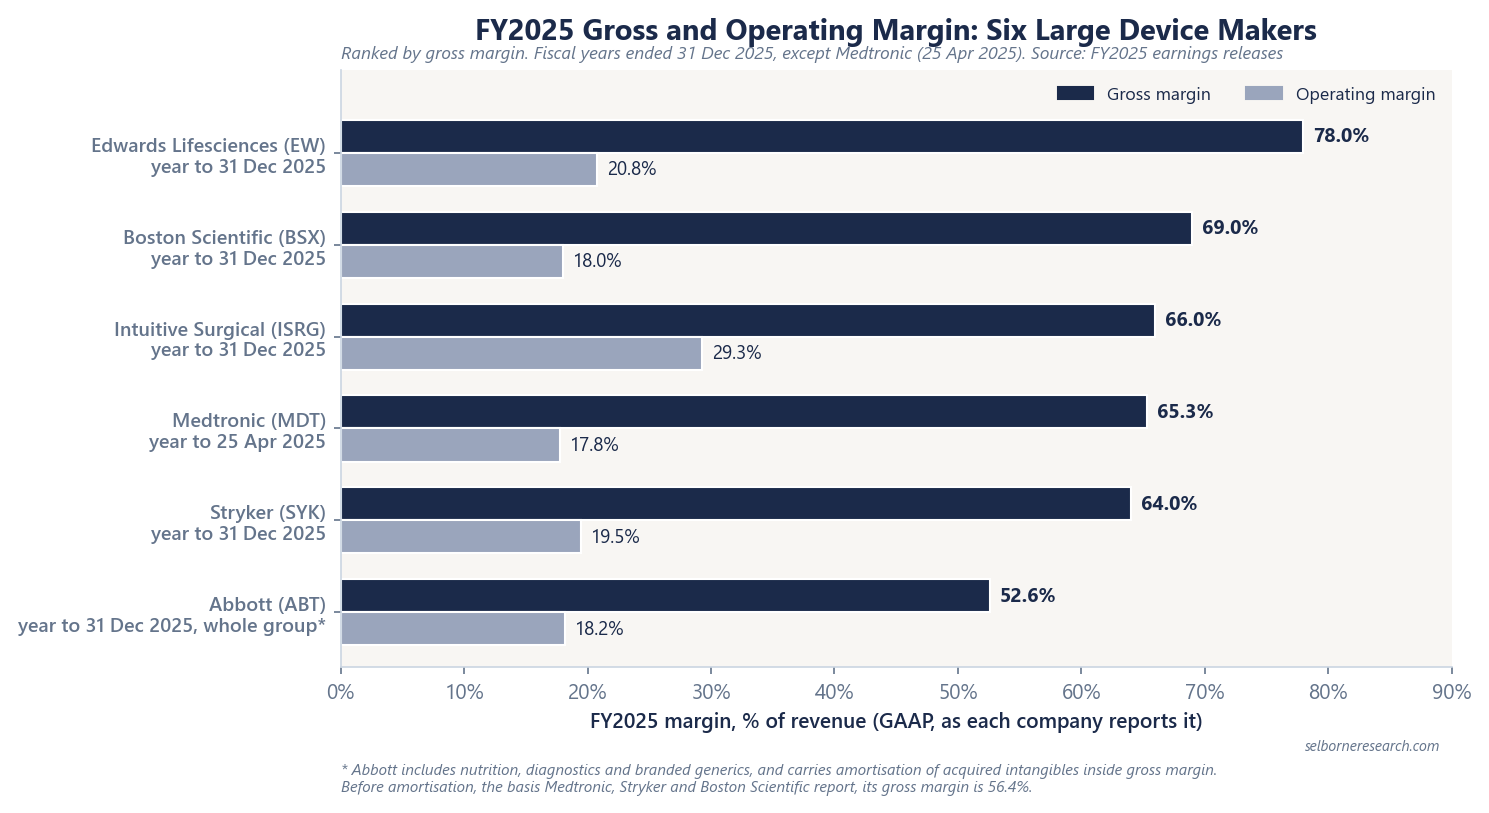
Three things in the table change how a row should be read.
Where amortisation sits. When a company buys another, it books the acquired patents and product rights as intangible assets and writes them off over several years. Abbott charges that amortisation against gross margin. Medtronic, Stryker and Boston Scientific show it as a separate expense below gross profit. On their basis Abbott’s gross margin is 56.4%, 3.8 points higher. Abbott stays last, so the order holds, but a gap of that size between two rows can be pure presentation. Intuitive and Edwards carry under $10M of amortisation each, so for them the placement makes no visible difference.
Adjusted figures barely move at the gross line. Five of the six adjust gross margin by 1.6 points or less; Intuitive’s adjustment is mostly share-based pay. Abbott’s 4.1 points is its amortisation plus $142M of other items. The large adjustments come lower down, at operating margin, and the GAAP vs adjusted operating margin guide takes them apart.
Medtronic’s year ends in April. Its FY2025 closed on 25 April 2025, eight months before the other five. Label the row so the gap is visible, and when the table is refreshed, check that each company’s latest full year is the one being used.
Product Mix Explains the Order
What a company sells decides where it lands. Three kinds of medtech revenue carry different costs. A surgical robot is a large machine assembled from many bought-in parts. Service revenue is mostly field engineers’ time. An implant or a single-use device is a small item that costs little to make relative to its price. None of the six reports gross margin split along those lines, so this is the reason for the order rather than a measured spread. What the filings do show fits it.
Edwards sells heart valves. Transcatheter aortic valve replacement, a valve delivered through a catheter, was 74% of its FY2025 net sales, transcatheter mitral and tricuspid therapies 9% and surgical structural heart products 17%. All three are heart-valve therapies, it sells no robot or other capital system, and it has the highest gross margin of the six.
Intuitive sells the robot as well as what the robot uses. Systems were 24.6% of FY2025 revenue and services 15.6%, with instruments and accessories the other 59.8%. Its gross margin sits mid-table. The razor-and-blade guide covers how that recurring revenue is built.
Abbott is the clearest case, because its segment note reports costs by business. The segment basis leaves out amortisation, so these figures sit beside the 56.4%, not the 52.6%.
| Abbott segment, FY2025 | Share of net sales | Segment gross margin |
|---|---|---|
| Medical Devices | 48.2% | 67.4% |
| Established Pharmaceuticals | 12.5% | 52.8% |
| Nutritionals | 19.1% | 45.9% |
| Diagnostics | 20.2% | 44.2% |
On its own, Abbott’s device business lands inside the range of the device makers above. Just over half of group sales come from businesses earning 44% to 53%, and the group figure is the blend. The 25.4-point gap between Abbott’s 52.6% and Edwards’ 78.0% splits roughly three ways: about 4 points of amortisation, about 11 points from blending in the non-device businesses, and about 11 points between Abbott’s devices and Edwards’ valves. Mix accounts for the last two.
Operating Margin Reorders the List
Gross margin is a ceiling. What reaches operating profit depends on what each company spends below it, and the step down changes the order.
| Company | Gross margin | R&D | SG&A | Other operating items | Operating margin |
|---|---|---|---|---|---|
| Edwards Lifesciences | 78.0% | 17.8% | 34.4% | 5.0% | 20.8% |
| Boston Scientific | 69.0% | 10.2% | 34.3% | 6.5% | 18.0% |
| Intuitive Surgical | 66.0% | 13.0% | 23.7% | 0.0% | 29.3% |
| Medtronic | 65.3% | 8.1% | 32.3% | 7.1% | 17.8% |
| Stryker | 64.0% | 6.5% | 34.4% | 3.6% | 19.5% |
| Abbott | 52.6% | 6.6% | 27.8% | 0.0% | 18.2% |
All GAAP, as a percentage of FY2025 revenue. Other operating items is gross profit less R&D, SG&A and operating income: amortisation where it sits below gross profit, plus restructuring, litigation and impairment charges, net of any operating income.
Intuitive is mid-table on gross margin and first on operating margin, at 29.3%. Selling, general and administrative costs took 23.7% of its revenue, against 32.3% to 34.4% at Edwards, Boston Scientific, Medtronic and Stryker, and it has no other operating lines of any size.
Edwards goes the other way. It spent 17.8% of revenue on R&D, the most of the six, and booked $325.4M of intellectual-property and litigation expense, 5.4% of revenue. A 78.0% gross margin became 20.8%.
Abbott’s 18.2% sits among the device specialists despite the lowest gross margin. Its R&D and SG&A ratios are among the lowest of the six, and its amortisation has already been charged above the gross line.
What Gross Margin Means for a Valuation
Gross margin earns its place in a valuation because it moves with mix, and mix is forecastable. A company’s gross margin drifts toward that of its fastest-growing line. If the higher-margin products grow faster than the rest, the group margin rises with no price increase and no cost cut, and the reverse is just as mechanical. A forecast built line by line catches that drift; a group margin extrapolated from last year does not.
Reported gross margin also moves for reasons unrelated to the products. An acquisition adds amortisation, which lands inside gross margin at some companies and below it at others. A divestiture of a lower-margin business lifts the group figure overnight. Before reading a change in a company’s gross margin as a change in its business, check the reconciliation and the segment note.
And gross margin on its own sets no value. Free cash flow comes from operating margin, after R&D and selling costs, then tax and reinvestment. In the table above, a 78.0% gross margin and a 64.0% one finish 1.3 points apart at operating level. The operating-margin assumption carries the value in a DCF; gross margin is the check that the assumption fits what the company actually sells.
Gross margin is the first line. The primer takes it through R&D and selling costs to the operating margin a franchise DCF starts from.
- 15 sections, installed base and pull-through to a franchise DCF, the runway a price implies and growth-adjusted P/E
- 44 pages
- a razor-blade franchise and a diversified grower
- 2 worked archetypes
- large-cap device makers on filed organic growth, margins and free cash flow
- 6-company screen
The Excel model is the primer's franchise DCF live across 11 sheets: a razor-blade franchise and a diversified grower valued over 20 years on funded free cash flow, with growth held for a runway and then faded to terminal, an operating margin path and a WACC built from the cost of equity and after-tax debt; a runway table showing how many years of growth the illustrative price pays for; a valuation summary; the installed-base build; P/E implied by the DCF value and by the price, each growth-adjusted; organic-versus-reported checks; and a sensitivity grid. Change organic growth, the runway, ROIC or the WACC and the value moves.
See what's in the Medtech Sector Primer →£25 PDF · £59 with the Excel model · £159 for all three Healthcare industries
Frequently Asked Questions
- What gross margin do large medical device companies earn?
- Among six large listed device makers, FY2025 GAAP gross margins ran from 52.6% at Abbott, whose group includes nutrition, diagnostics and branded generics, to 78.0% at Edwards Lifesciences. The other four sat between 64.0% and 69.0%. Abbott's Medical Devices segment on its own earned 67.4% on its segment basis, inside the same range. Medtronic's figure is for the year ended 25 April 2025; the rest are calendar 2025.
- Why is Abbott's gross margin lower than other medtech companies?
- Two reasons. Just over half of Abbott's FY2025 sales came from nutrition, diagnostics and established pharmaceuticals, with segment gross margins of 45.9%, 44.2% and 52.8%, against 67.4% for its devices. And Abbott charges amortisation of acquired intangibles, $1,682M in FY2025, against gross margin, where Medtronic, Stryker and Boston Scientific show it below gross profit. On their basis Abbott's gross margin is 56.4% rather than 52.6%.
- Why does Intuitive Surgical have a higher operating margin than Edwards Lifesciences with a lower gross margin?
- Because of the costs below gross profit. In FY2025 Intuitive's selling, general and administrative costs were 23.7% of revenue and R&D 13.0%, turning a 66.0% gross margin into a 29.3% operating margin. Edwards spent 34.4% on SG&A and 17.8% on R&D, and booked $325.4M of intellectual-property and litigation expense, so its 78.0% gross margin became a 20.8% operating margin.
- Can you get the gross margin on consumables versus capital equipment from filings?
- Not for these six. None reported a gross margin split between capital equipment, consumables and services in its FY2025 filings. Intuitive splits cost of revenue between product and service only, and Abbott splits it by business segment. The mix has to be read from revenue lines, such as Intuitive's systems, instruments and services revenue.
Read next
Razor-and-Blade Economics in Medtech
How capital platforms convert to recurring pull-through: ISRG 84% recurring mix, I&A at $1,810 per da Vinci procedure, recurring-revenue screens, and a worked 5,000-system example.
GAAP vs Adjusted Operating Margin in Medtech
What device makers leave out of adjusted operating margin: amortisation from past deals, restructuring, litigation and share-based pay, how six filers define adjusted, and which margin a DCF should carry.
See it applied
These company profiles apply the concepts from this guide to real public companies.