Healthcare · Medtech
Organic vs Reported Growth in Medtech
Strip out M&A before comparing medtech growth: Boston Scientific Urology +4.7% organic vs +23.1% reported, and FY2025 organic growth for six peers.
Selborne Research · Medtech coverage: 7 guides, 6 company profiles, a primer and Excel model
Educational analysis for professional use. This guide is not investment advice or a recommendation to buy or sell any security, and it is not personalised.
On this page
Reported Growth Flatters Acquisitive Device Makers
A medtech earnings release leads with reported growth, which includes revenue from businesses bought during the year. Organic growth takes that out. Skip the footnote and Medtronic’s 4.9% organic rate (FY2025) ends up set against Boston Scientific’s 19.9% reported rate, which was 15.8% organic.
The fix is one table, the reconciliation at the back of the earnings release. Read it before any growth-adjusted P/E screen.
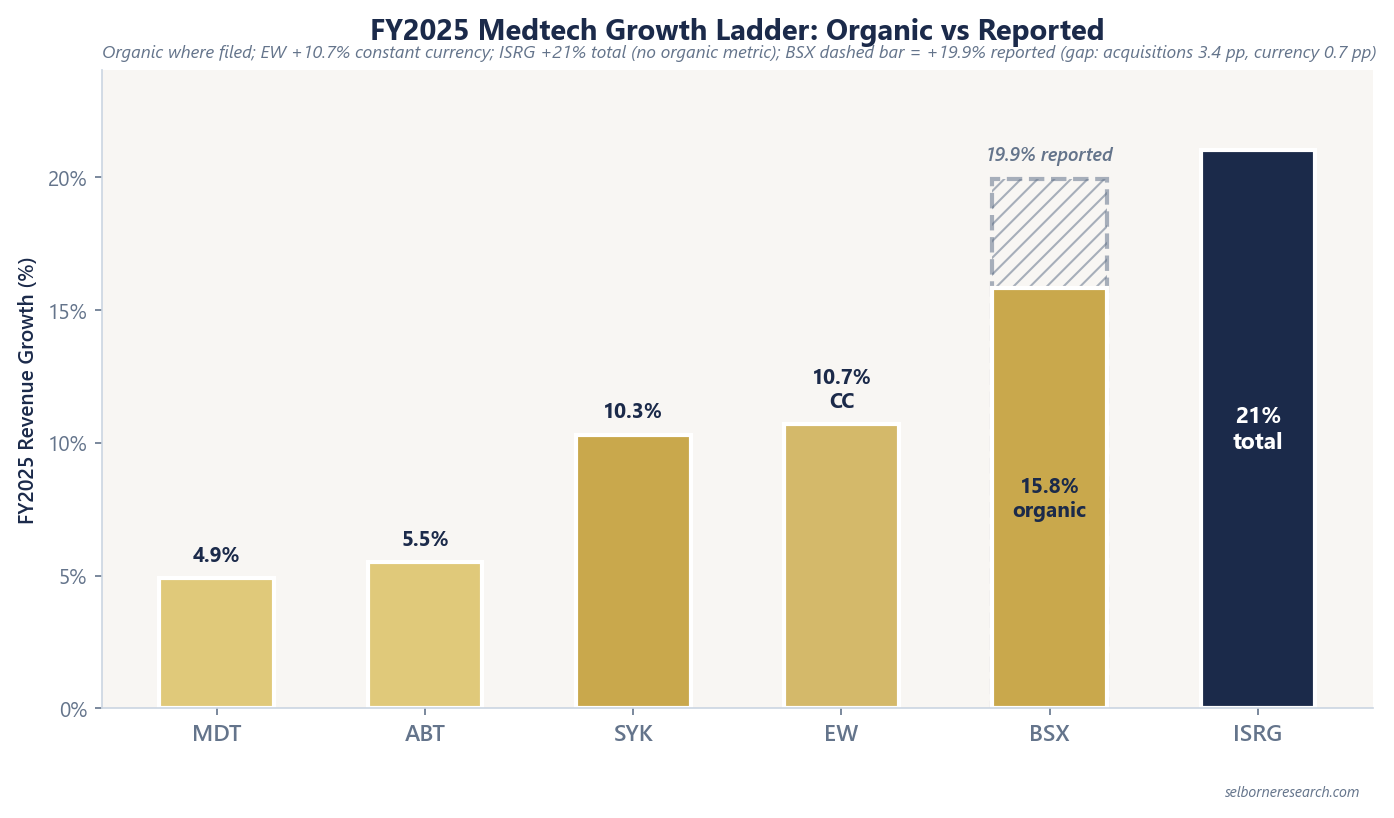
FY2025 Growth, Six Filers
| Company | Growth metric (FY2025) | Basis | Net sales |
|---|---|---|---|
| MDT | 4.9% organic | Excludes FX, Other revenue, significant M&A | $33.5B |
| ABT | 5.5% organic | 6.7% ex COVID testing | $44.3B |
| SYK | 10.3% organic | 9.9% volume + 0.4% price | $25.1B |
| EW | 10.7% constant currency | Excludes FX and newly acquired products | $6.1B |
| BSX | 15.8% organic | Excludes FX and <1 full period M&A | $20.1B |
| ISRG | 21% total revenue growth | No organic line filed | $10.1B |
Medtronic’s fiscal year ended on 25 Apr 2025; the other rows are calendar 2025. Edwards and Intuitive do not say “organic”, so read their definitions before setting +10.7% constant currency or 21% total growth beside Boston Scientific’s organic rate.
Boston Scientific’s Urology Segment
The group gap is modest. Urology’s is not.
| BSX segment / group | Reported FY2025 growth | Organic FY2025 growth | Gap |
|---|---|---|---|
| Group | +19.9% | 15.8% | 4.1 pp |
| Cardiovascular | +23.2% | +20.8% | 2.4 pp |
| Urology | +23.1% | +4.7% | 18.4 pp |
On reported numbers Urology looked like a high-growth franchise. Organic growth was +4.7%. The reconciliation table in the FY2025 earnings release puts 17.9 of the 18.4 points down to acquisitions; currency and rounding make up the rest.
Cardiovascular grew +20.8% organically, so the group’s 15.8% blended a fast segment with a slow one. For an acquirer, read organic growth by segment.
Definitions Differ
Each filer writes its own definition, as the Basis column above shows. Medtronic strips “significant” deals and a small Other revenue line ($48M in FY2025, against $221M a year earlier); Boston Scientific strips any deal owned for less than a full comparable period. So even a comparison such as Medtronic’s 4.9% against Abbott’s 5.5% is approximate.
Multiples Follow Growth, So Use the Clean Number
Bain’s medtech work links roughly two turns of forward EV multiple to each 100 bps of revenue growth for companies above $3B revenue (valuations as of 14 Jan 2024). That relationship is about underlying demand, not revenue bought through deals.
Put 19.9% reported growth into a growth-adjusted P/E where 15.8% organic belongs and you credit the business with growth it bought. In Urology, with a gap over 18 points, the error is far larger.
Worked Example: Boston Scientific’s Group Reconciliation
Boston Scientific FY2025 net sales were $20,074M.
| Step | Calculation | Result |
|---|---|---|
| Reported growth | Per earnings release | +19.9% |
| Organic growth | Per earnings release | 15.8% |
| Gap | 19.9% − 15.8% | 4.1 pp (acquisitions 3.4 pp, currency 0.7 pp) |
| Prior-year sales | $20,074M ÷ 1.199 | ~$16.7B |
| This year’s sales at the organic rate | ~$16.7B × 1.158 | ~$19.4B |
| Sales from acquisitions and currency | $20,074M − ~$19.4B | ~$0.7B |
About $0.7B of FY2025 sales came from acquisitions and currency, most of it (3.4 of the 4.1 points) from deals, which is revenue the balance sheet bought.
Set beside Intuitive’s 21%, Boston Scientific’s 19.9% reported rate looks close; its 15.8% organic rate is five points behind. The organic comparison is the fairer one, though Intuitive files only total growth.
Fast Growth Without Deals
Razor-and-blade economics explain how procedures on an installed platform compounded Intuitive’s instruments and accessories revenue +19%, and Boston Scientific’s Cardiovascular segment grew +20.8% organically. Urology shows how far a reported headline can drift from the business underneath.
The Boston Scientific and Medtronic profiles carry the segment detail; Medtronic’s April year-end applies throughout its profile.
A franchise DCF charges reinvestment for every point of growth, fades that growth year by year, and asks how many years of it a price pays for.
- 15 sections, installed base and pull-through to a franchise DCF, the runway a price implies and growth-adjusted P/E
- 44 pages
- a razor-blade franchise and a diversified grower
- 2 worked archetypes
- large-cap device makers on filed organic growth, margins and free cash flow
- 6-company screen
The Excel model is the primer's franchise DCF live across 11 sheets: a razor-blade franchise and a diversified grower valued over 20 years on funded free cash flow, with growth held for a runway and then faded to terminal, an operating margin path and a WACC built from the cost of equity and after-tax debt; a runway table showing how many years of growth the illustrative price pays for; a valuation summary; the installed-base build; P/E implied by the DCF value and by the price, each growth-adjusted; organic-versus-reported checks; and a sensitivity grid. Change organic growth, the runway, ROIC or the WACC and the value moves.
See what's in the Medtech Sector Primer →£25 PDF · £59 with the Excel model · £159 for all three Healthcare industries
Frequently Asked Questions
- What is organic revenue growth in medtech?
- Organic growth strips out foreign exchange and any acquisitions or divestitures not owned for a full comparable period. Medtronic excludes FX, Other revenue and significant M&A. Boston Scientific excludes FX and deals owned for less than one full period. What is left is what procedure volume and price/mix did on their own.
- Why can reported growth exceed organic growth by double digits?
- Acquisitions add revenue that was not in the prior-year base. Boston Scientific FY2025 reported +19.9% against 15.8% organic, a 4.1 pp gap of which acquisitions were 3.4 pp and currency 0.7 pp. Urology was the extreme: +23.1% reported against +4.7% organic, with acquisitions accounting for 17.9 of the 18.4 points in the company's reconciliation.
- How much does growth quality affect medtech valuations?
- Bain cites roughly two turns of forward EV multiple per 100 bps of revenue growth for medtech companies above $3B revenue (valuations as of 14 Jan 2024). Inflating the growth input with M&A overstates how much multiple the underlying business earned.
- Do all medtech companies report organic growth?
- No. Edwards Lifesciences files constant-currency growth (+10.7% FY2025) but no organic label. Intuitive Surgical reports 21% total revenue growth with no organic line. Use each filer's own growth metric and footnote the basis in any peer table.
Read next
Growth-Adjusted P/E for Devices
Forward P/E divided by organic growth: why one headline multiple means different things at 6% and 12% growth, and which growth figure to divide by.
Razor-and-Blade Economics in Medtech
How capital platforms convert to recurring pull-through: ISRG 84% recurring mix, I&A at $1,810 per da Vinci procedure, recurring-revenue screens, and a worked 5,000-system example.
GAAP vs Adjusted Operating Margin in Medtech
What device makers leave out of adjusted operating margin: amortisation from past deals, restructuring, litigation and share-based pay, how six filers define adjusted, and which margin a DCF should carry.
See it applied
These company profiles apply the concepts from this guide to real public companies.