Healthcare · Pharmaceuticals
Patent Cliffs and LOE Erosion
How loss of exclusivity erodes branded drug revenue: generic unit-share curves, price erosion by competitor count, the Humira biosimilar case and a worked fade.
Selborne Research · Pharmaceuticals coverage: 7 guides, 6 company profiles, a primer and Excel model
Educational analysis for professional use. This guide is not investment advice or a recommendation to buy or sell any security, and it is not personalised.
On this page
Loss of Exclusivity Cuts Volume and Price at Once
When a branded drug loses exclusivity (LOE), cheaper copies can enter and revenue falls on two fronts. Payers switch prescriptions to the copies, so volume goes, and the prescriptions that stay are repriced against them, so price goes too. Stopping at “patent expires 2028” misses most of the economics. Forecast each product: a dated LOE event, a schedule of lost units, a net-price curve keyed to the number of generics, then a sum across the portfolio.
Small molecules (chemically made drugs, usually pills) and biologics (large proteins made in living cells) follow different paths. A small-molecule brand loses most units within 12 months of the first generic. A biologic’s copies, called biosimilars, take share more slowly, through rebates and placement on insurers’ lists of covered drugs.
Small-Molecule Generic Erosion: Unit Share
Grabowski et al. (Analysis Group) studied US brand and generic competition for entries from 1995 to 2019. Twelve months after the first generic:
| Brand profile | Brand unit share retained | Unit share lost |
|---|---|---|
| All new molecular entities (NMEs) | 23% | ~77% |
| Brands > $250M pre-entry | 18% | ~82% |
Under Hatch-Waxman, the US law on generic entry, the first generic filer can hold 180 days of exclusivity. That delays full competition but does not stop the volume shift once more generics arrive.
Net Price Erosion by Generic Count
Volume is half the story. FDA data on generic entries in 2015 to 2017 compare the average generic price with the brand’s average manufacturer price (AMP):
| Generic competitors | Generic price vs brand AMP |
|---|---|
| 1 | ~39% below brand |
| 2 | ~54% below |
| 4 | ~79% below |
| ≥6 | >95% below |
Revenue is units times net price, so a brand can keep a sliver of loyal prescriptions and still lose most of its dollars.
Biosimilar Contrast: Humira
Humira, AbbVie’s arthritis and immune-disease drug, shows the slower biosimilar path. Its worldwide revenue fell 58%, from $21,237M in 2022 to $8,993M in 2024; US revenue fell 62%, from $18,619M to $7,142M, across two years of biosimilar entry. That is severe, but slower than the small-molecule path in the worked example below, where sales drop to 30% and then 12% in the first two years.
IQVIA’s February 2025 report, on data to June 2024, counts 118 US biologics with roughly $234bn of sales facing LOE between 2025 and 2034. Use that count for biologic timing; headline cliff totals mix too many products and dates.
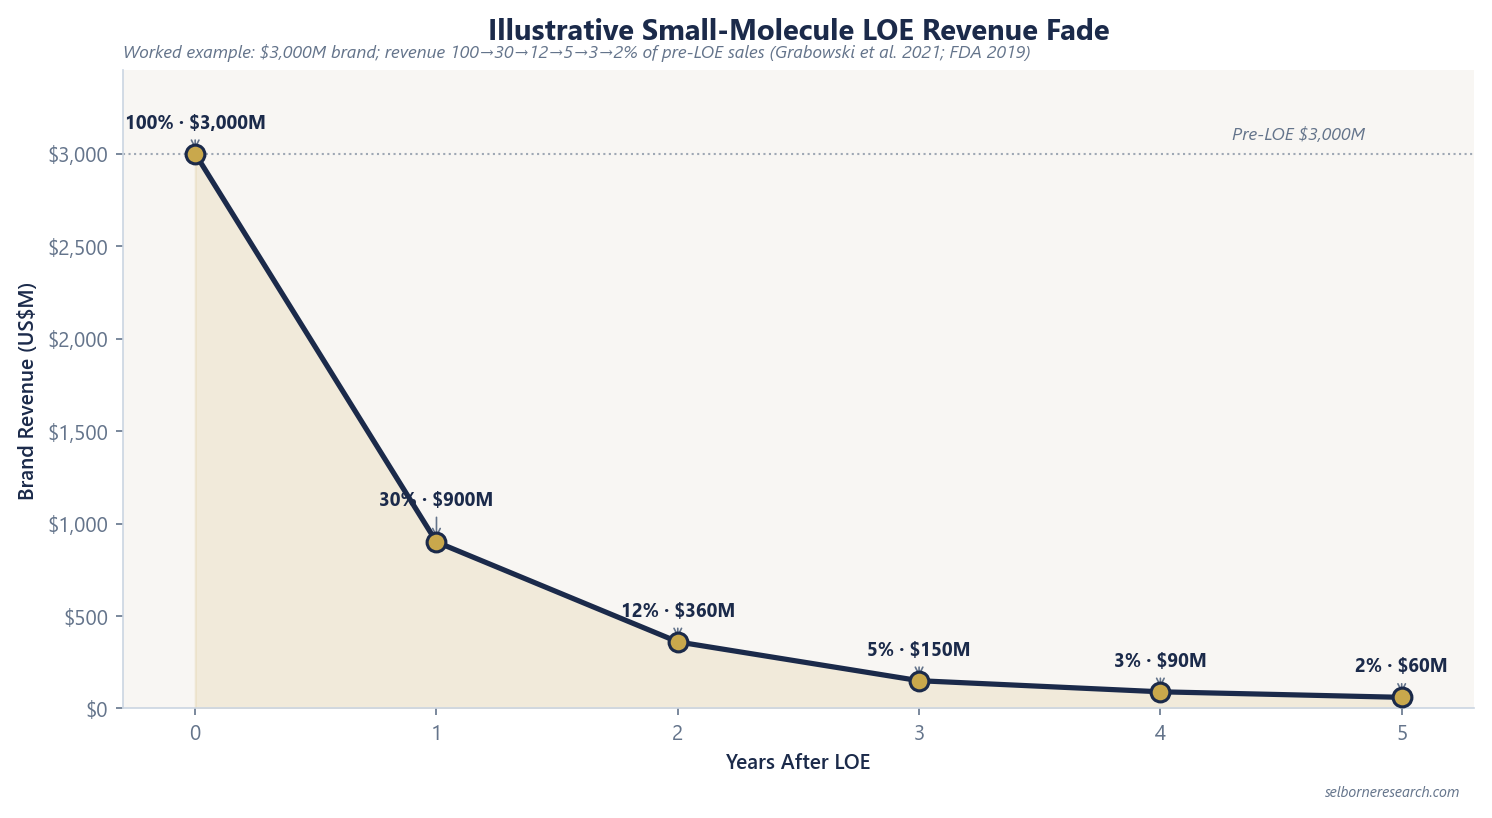
Worked Example: Cardiozine at $3,000M Pre-LOE
Take a hypothetical $3,000M small-molecule brand facing several generics. The fade uses 23% unit retention at 12 months (Grabowski et al.) and a net-price discount deepening towards more than 95% by year 3 (FDA generic pricing data). Year 1 averages the first twelve months, while share slides towards 23%:
| Year post-LOE | % of pre-LOE sales | Revenue ($M) |
|---|---|---|
| 0 (LOE) | 100% | $3,000 |
| 1 | 30% | $900 |
| 2 | 12% | $360 |
| 3 | 5% | $150 |
| 4 | 3% | $90 |
| 5 | 2% | $60 |
Models start from this shape. They then add offsets elsewhere in the portfolio (new launches, price rises on other brands) and Medicare prices set under the Inflation Reduction Act (IRA), which cut price on selected older drugs while they are still under patent.
Building the Forecast in a Model
- List each material product with its compound-patent or settled generic entry date from the 10-K patent table. The patent expiry guide sets out six large filers’ dates, from Merck’s Keytruda (December 2028, 48.7% of FY2025 sales) to AbbVie’s Humira, and keeps IRA price dates apart.
- Assign a unit-retention curve: the small-molecule or the biosimilar schedule.
- Layer net-price erosion by the expected number of generics in years 1, 2 and 3.
- Sum the products and check the total against any company guidance (Pfizer’s ~$1.5B of 2026 LOE losses is a useful cross-check).
- Set the lost cash flows in later years against new launches, valued with risk-adjusted NPV (rNPV), which weights each pipeline drug by its odds of approval. The rNPV pipeline guide covers the method, and concentration risk flags when one LOE event moves the whole company.
Model the benchmark generic path first. Argue for a slower case only where insurer coverage or an authorised generic (a copy sold by or for the brand owner) changes it.
A base business, a drug at its patent cliff, a growing biologic and a Phase III asset, each valued year by year and summed to value per share.
- 15 sections, the patent ladder to a year-by-year sum-of-parts valuation and concentration screens
- 39 pages
- a small molecule at its cliff, a biologic growth driver and a pipeline asset weighted by its phase, plus a base business
- 3 drug schedules
- large-cap innovators on filed product concentration and loss-of-exclusivity dates
- 6-company screen
The Excel model is the primer's sum-of-parts valuation live across 13 sheets: a base-business DCF at an 8.5% WACC; three drug schedules, each set to marketed or pipeline and to a clinical phase that sets its odds; loss-of-exclusivity cliffs that settle on a generic floor; a calendar-year input that turns a filed patent date into a schedule year; the consolidated bridge to value per share; and patent-cliff, concentration and sensitivity views. Change a drug's LOE year, phase or peak sales, or the WACC, and the value moves.
See what's in the Pharmaceuticals Sector Primer →£25 PDF · £59 with the Excel model · £159 for all three Healthcare industries
Frequently Asked Questions
- What is a patent cliff in pharmaceuticals?
- A patent cliff is the scheduled loss of exclusivity on a major branded drug when composition-of-matter or other blocking patents expire and generics or biosimilars enter. Revenue falls because payers switch volume to lower-priced copies and the brand loses pricing power. Analysts model it drug by drug, not as a single corporate percentage.
- How fast do generic drugs erode brand sales after LOE?
- For small-molecule brands, Grabowski et al. (2021) find the originator retains about 23% of unit share 12 months after first generic entry (a 77% unit loss). For brands above $250M pre-entry, retention drops to about 18% (82% loss). Net price falls further as generic count rises: one generic prices near 39% below brand average manufacturer price; six or more generics push discounts above 95%.
- How is biosimilar erosion different from generic erosion?
- Biosimilar entry is slower and more rebate-driven than small-molecule generic entry. AbbVie's filed Humira revenue path is the teaching case: U.S. sales fell from $18,619M (2022) to $7,142M (2024), a 62% decline over two years, versus the steeper multi-generic small-molecule curve. IQVIA's February 2025 report counts 118 U.S. biologics with roughly $234bn of sales facing LOE between 2025 and 2034.
- Why forecast LOE drug by drug instead of citing cliff headlines?
- Aggregate patent-cliff headlines mix timing, disease area and speed of decline. A drug-by-drug forecast ties each loss-of-exclusivity (LOE) date to published unit-share and price curves, then sums the products. Pfizer expects to lose roughly $1.5B of revenue to LOE in 2026 (~2.4% of FY2025 revenue); Merck has ~48.7% of FY2025 sales in Keytruda, whose compound patent protection ends from December 2028. Those numbers only make sense in a line-by-line schedule.
Read next
rNPV: Valuing Drug Pipelines
Risk-adjusted NPV for drug pipelines: PoS-weighted cash flows, an 8.5% WACC built on a 4.50% 10-year Treasury rate, and a worked Phase III asset at $1,621M.
Pharma Revenue Concentration Risk
Largest-product revenue share as a risk screen: FY2025 ladder from Pfizer Eliquis 12.7% to Lilly tirzepatide 56.0%, with 25–30% and 40% concentration screens.
Pharma Patent Expiry Dates by Company
Patent and IRA Medicare price dates from six large drugmakers' filings, product by product: where the dates sit in a 10-K, what settled generic entry means, and why one revenue-at-risk figure misleads.
See it applied
These company profiles apply the concepts from this guide to real public companies.