Healthcare · Pharmaceuticals
Pharma R&D Intensity by Company
R&D ran from 14.9% to 24.3% of FY2025 revenue at six large drugmakers. Where acquired R&D is booked, what the 20.9% industry average covers, and its limits.
Selborne Research · Pharmaceuticals coverage: 7 guides, 6 company profiles, a primer and Excel model
Educational analysis for professional use. This guide is not investment advice or a recommendation to buy or sell any security, and it is not personalised.
On this page
R&D Intensity Measures Reinvestment, Not Output
R&D intensity is research and development expense divided by revenue. It shows how much of each sales dollar a drugmaker puts back into finding its next products. Two companies at 20% can be in very different positions: one may earn half its revenue from a single drug and the other spread it across dozens, or one may spend on late-stage trials and the other on early research.
Because it is a ratio, currency drops out: Novo Nordisk’s figure, computed in Danish kroner, compares directly with the dollar filers. Accounting does not drop out. Three choices about what goes into the R&D line can move the ratio by more than eight points, close to the whole spread between the six companies below. The biggest is acquired in-process R&D (IPR&D): the upfront a company pays to license or buy a drug candidate, which some filers show on its own line.
FY2025 R&D Intensity, Six Filers
| Company | R&D expense | Revenue | R&D % of revenue | Acquired IPR&D on its own line | Fiscal year end |
|---|---|---|---|---|---|
| Merck | $15,789M | $65,011M | 24.3% | None; deal charges sit inside R&D | 31 Dec 2025 |
| Eli Lilly | $13,337M | $65,179M | 20.5% | $2,910M | 31 Dec 2025 |
| Novo Nordisk | DKK 52,039M | DKK 309,064M | 16.8% | None; acquired projects capitalised (IFRS) | 31 Dec 2025 |
| Pfizer | $10,437M | $62,579M | 16.7% | $1,613M | 31 Dec 2025 |
| Johnson & Johnson | $14,665M | $94,193M | 15.6% | None; inside R&D | 28 Dec 2025 |
| AbbVie | $9,096M | $61,160M | 14.9% | $5,016M | 31 Dec 2025 |
Each company’s own figures, from its FY2025 Form 10-K (Novo Nordisk: Form 20-F and Annual Report 2025). Johnson & Johnson’s figures cover the whole group, including MedTech.
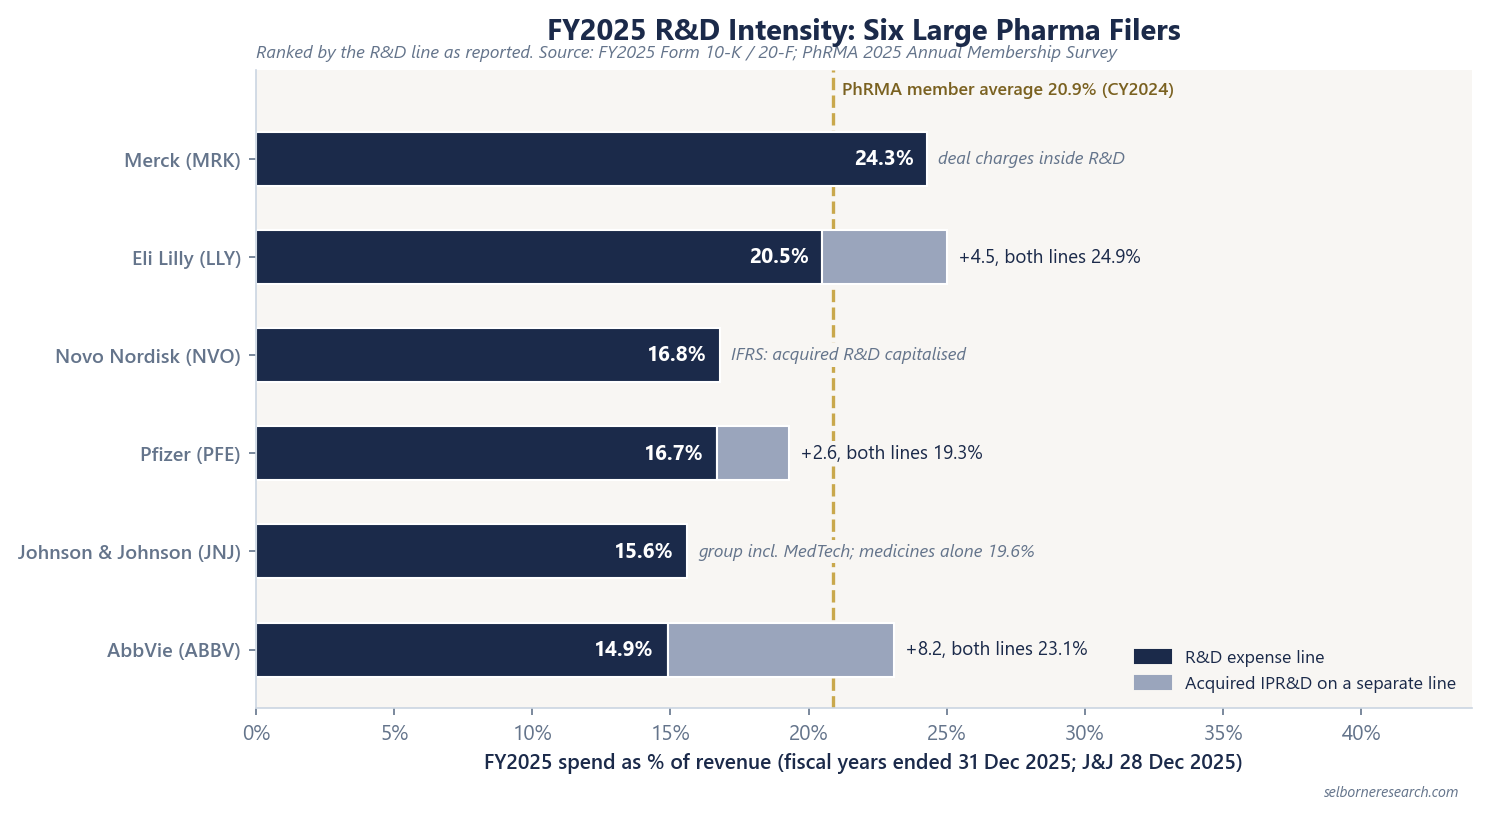
Five of the six sit inside the 15% to 25% range often quoted for large innovator drugmakers, and AbbVie’s 14.9% sits just below it. The order changes once the same costs are counted for everyone.
Three Accounting Choices Move the Ratio
Where acquired R&D lands. A drugmaker that licenses a candidate, or buys a company that is little more than one candidate, expenses the upfront payment under US GAAP as acquired in-process R&D. Eli Lilly, Pfizer and AbbVie report it on a separate line below R&D. Merck and Johnson & Johnson book the same kind of payment inside R&D; Merck’s FY2025 R&D includes licence upfronts and asset-acquisition charges on top of $10.8bn of direct research costs. Counting both lines for everyone:
| Company | R&D line | Plus acquired IPR&D | Both lines |
|---|---|---|---|
| Eli Lilly | 20.5% | 4.5 points | 24.9% |
| Merck | 24.3% | already inside | 24.3% |
| AbbVie | 14.9% | 8.2 points | 23.1% |
| Pfizer | 16.7% | 2.6 points | 19.3% |
AbbVie moves from last to third with no change in what it spent; the $5,016M simply sat on a different line. Novo Nordisk is a separate case. Under IFRS it capitalises acquired R&D projects as intangible assets, so a licence deal never passes through its R&D expense; only a later write-down of a failed asset would.
Impairments inside R&D. When an acquired candidate fails, some filers book the write-down in R&D; others, such as Johnson & Johnson, show it on a line of its own. AbbVie’s FY2024 R&D of $12,791M included a $4.5bn write-down of an acquired schizophrenia candidate whose Phase 2 trials missed their primary endpoint. That year its ratio was 22.7%; a year later, without the charge, it was 14.9%. Novo Nordisk’s FY2025 R&D includes DKK 2,742M of intangible-asset impairments and DKK 1,588M on property and equipment, together 1.4 points of sales. A single year’s ratio can carry a one-off of this size, so compare several years.
What the denominator covers. Johnson & Johnson’s 15.6% is for the group. Its Innovative Medicine segment spent $11,827M, 19.6% of its $60,401M of sales, while MedTech spent 8.4%. Merck’s R&D includes its animal health research. Before comparing a diversified group with a pure drugmaker, find the pharmaceutical segment figure if the filer gives one.
The 20.9% Industry Average
The industry figure comes from the Annual Membership Survey of PhRMA, the US trade body for research drugmakers. Its 2025 edition reports that member companies spent $104,344M on R&D in 2024 against $500,423M of sales, 20.9%. Two limits come with it. It counts company-financed R&D only. And its sales figure leaves out sales made abroad by the foreign divisions of foreign-owned members, so it is not a straight sum of the members’ reported revenue.
The figure also moves: the same survey gives 19.1% for 2022 and 21.4% for 2023. Treat 20.9% as a reference line for one year.
Biotech companies are left out of this comparison on purpose. With one or two products and a smaller revenue base, their ratio measures something different; the phase success rates guide covers the biotech side.
From Spend to Output: What an Approval Costs
A productivity measure needs approvals in the numerator and dollars in the denominator, and R&D intensity has neither. The cost-per-approval studies try to supply both, with answers that depend heavily on method.
| Study | Estimate | What it counts |
|---|---|---|
| DiMasi, Grabowski and Hansen (2016) | $2,558M per approved drug, 2013 dollars | Pre-approval spend on the drug and on the failures behind it, capitalised at the cost of capital |
| Deloitte (2024) | $2.23bn per asset | Average cost from discovery to launch for a top-20 pharma cohort |
They measure different things, do not reconcile, and neither should be applied to a named company. What they share is the reason the number is large: most candidates fail. Of drugs entering Phase I, 7.9% reach approval on the BIO 2011-2020 rates, so every approval carries the cost of about a dozen that did not make it. The probability of success guide shows how those rates chain.
What R&D Intensity Means for a Valuation
R&D is expensed as it is spent, so heavy spending lowers reported margins now for revenue that arrives years later. In a DCF that makes R&D part of the cost of keeping the business going. The operating margin that carries into the terminal value has to be struck after the R&D needed to replace products as their patents expire. A margin lifted by cutting R&D looks better for a few years and leaves less behind the next exclusivity date.
Acquired IPR&D belongs in the same bucket. It comes in lumps, which tempts analysts to strip it out as one-off. For a company that refills its pipeline by buying candidates, though, those payments recur, so an average over several years belongs in the forecast.
Inside a risk-adjusted valuation of a single drug, R&D enters differently from revenue. Revenue is multiplied by the probability of approval. The trial spend committed to reach that approval is not, because it is paid whether the trial succeeds or not. The rNPV guide sets out the method this sits inside.
R&D is the cost of staying in business. The primer places it in the margin and values a pipeline asset net of committed trial spend.
- 15 sections, the patent ladder to a year-by-year sum-of-parts valuation and concentration screens
- 39 pages
- a small molecule at its cliff, a biologic growth driver and a pipeline asset weighted by its phase, plus a base business
- 3 drug schedules
- large-cap innovators on filed product concentration and loss-of-exclusivity dates
- 6-company screen
The Excel model is the primer's sum-of-parts valuation live across 13 sheets: a base-business DCF at an 8.5% WACC; three drug schedules, each set to marketed or pipeline and to a clinical phase that sets its odds; loss-of-exclusivity cliffs that settle on a generic floor; a calendar-year input that turns a filed patent date into a schedule year; the consolidated bridge to value per share; and patent-cliff, concentration and sensitivity views. Change a drug's LOE year, phase or peak sales, or the WACC, and the value moves.
See what's in the Pharmaceuticals Sector Primer →£25 PDF · £59 with the Excel model · £159 for all three Healthcare industries
Frequently Asked Questions
- What percentage of revenue do pharma companies spend on R&D?
- PhRMA's 2025 Annual Membership Survey puts its member companies' R&D at 20.9% of sales in 2024: $104,344M of company-financed R&D on $500,423M of sales. Among six large filers, FY2025 R&D ran from 14.9% of revenue at AbbVie to 24.3% at Merck. The survey figure itself moved between 19.1% and 21.4% over 2022 to 2024.
- Why do some pharma companies report acquired IPR&D separately from R&D?
- Under US GAAP, when a company licenses or buys a drug candidate without buying a whole business, the upfront payment is expensed as acquired in-process R&D. Eli Lilly, Pfizer and AbbVie show it on its own line; Merck and Johnson & Johnson include it in R&D. In FY2025 the separate line added 4.5 points to Lilly's ratio, 2.6 to Pfizer's and 8.2 to AbbVie's. Novo Nordisk reports under IFRS and capitalises acquired R&D projects as intangible assets.
- How much does it cost to develop a new drug?
- Estimates depend on method. DiMasi and colleagues (2016) put the capitalised cost per approved drug at $2,558M in 2013 dollars, counting failed candidates and the cost of capital. Deloitte's 2024 study of a top-20 pharma cohort put the average cost of taking an asset from discovery to launch at $2.23bn. Neither is a figure for any single company.
Read next
rNPV: Valuing Drug Pipelines
Risk-adjusted NPV for drug pipelines: PoS-weighted cash flows, an 8.5% WACC built on a 4.50% 10-year Treasury rate, and a worked Phase III asset at $1,621M.
Drug Development Probability of Success
How probability of success enters a drug valuation: the chain from the current phase, why committed trial spend is not weighted, and biologics vs small molecules.
See it applied
These company profiles apply the concepts from this guide to real public companies.