Healthcare · Biotech
Clinical Trial Success Rates by Phase
What each FDA trial phase tests and how often drugs pass it: BIO/Informa 2011-2020 rates of 52.0%, 28.9%, 57.8% and 90.6%, 7.9% from Phase I to approval.
Selborne Research · Biotech coverage: 7 guides, 6 company profiles, a primer and Excel model
Educational analysis for professional use. This guide is not investment advice or a recommendation to buy or sell any security, and it is not personalised.
On this page
Each Phase Gate Culls Most Candidates
Drug development is a series of gates, and most candidates fail one. A drug must show it is safe enough to dose (Phase I), that it does something in patients (Phase II) and that it works at scale (Phase III). The company then files a New Drug Application (NDA), or a Biologics License Application (BLA) for a biologic, and the FDA reviews it. Each gate has its own failure rate, and the rates multiply.
The standard reference is the study by BIO (the US biotech industry body), Informa and QLS of 9,704 development programmes over 2011 to 2020. Of candidates entering Phase I, 7.9% reached approval.
What Each Phase Tests
The FDA defines the phases in its regulations (21 CFR 312.21):
| Phase | What it tests | Typical size |
|---|---|---|
| Phase I | First use in people: how the drug is absorbed and cleared, and its side effects as the dose rises | 20 to 80 subjects |
| Phase II | Whether it works for a particular condition, plus common short-term side effects | No more than several hundred patients |
| Phase III | The evidence of effectiveness and safety needed to judge benefit against risk and write the label | Several hundred to several thousand |
| NDA/BLA | FDA review of the application | The filed package |
The phases run in sequence. A failed Phase II ends the programme, or sends it back for redesign, before the expensive trial starts. A small company’s cash runway, how long its cash lasts at the current spend, has to cover the time between gates.
How Often Candidates Pass Each Phase (BIO 2011-2020)
| Transition | Success rate | Programmes counted |
|---|---|---|
| Phase I → Phase II | 52.0% | 4,414 |
| Phase II → Phase III | 28.9% | 4,933 |
| Phase III → NDA/BLA | 57.8% | 1,928 |
| NDA/BLA → approval | 90.6% | 1,453 |
| Phase I → approval | 7.9% |
Each rate follows from what the phase asks.
- Phase I passes about half. It tests safety, not efficacy. The study also notes the rate may be flattered because some large companies do not report failed Phase I programmes.
- Phase II is the lowest. It is usually the first trial designed to show the drug works, and the point where a company decides whether to fund Phase III, sometimes for commercial rather than scientific reasons.
- Phase III passes more often than Phase II, because the candidates that reach it have already shown some effect. Its failures cost the most: these are the longest and most expensive trials.
- Review passes 90.6%, counting resubmissions after a first rejection.
Worked Example: Follow 100 Phase I Programmes
Put 100 programmes into Phase I and apply the BIO rates in turn:
| Stage reached | Programmes | Lost at this gate |
|---|---|---|
| Start Phase I | 100 | |
| Start Phase II | 52.0 | 48.0 |
| Start Phase III | 15.0 | 37.0 |
| File NDA/BLA | 8.7 | 6.3 |
| Approved | 7.9 | 0.8 |
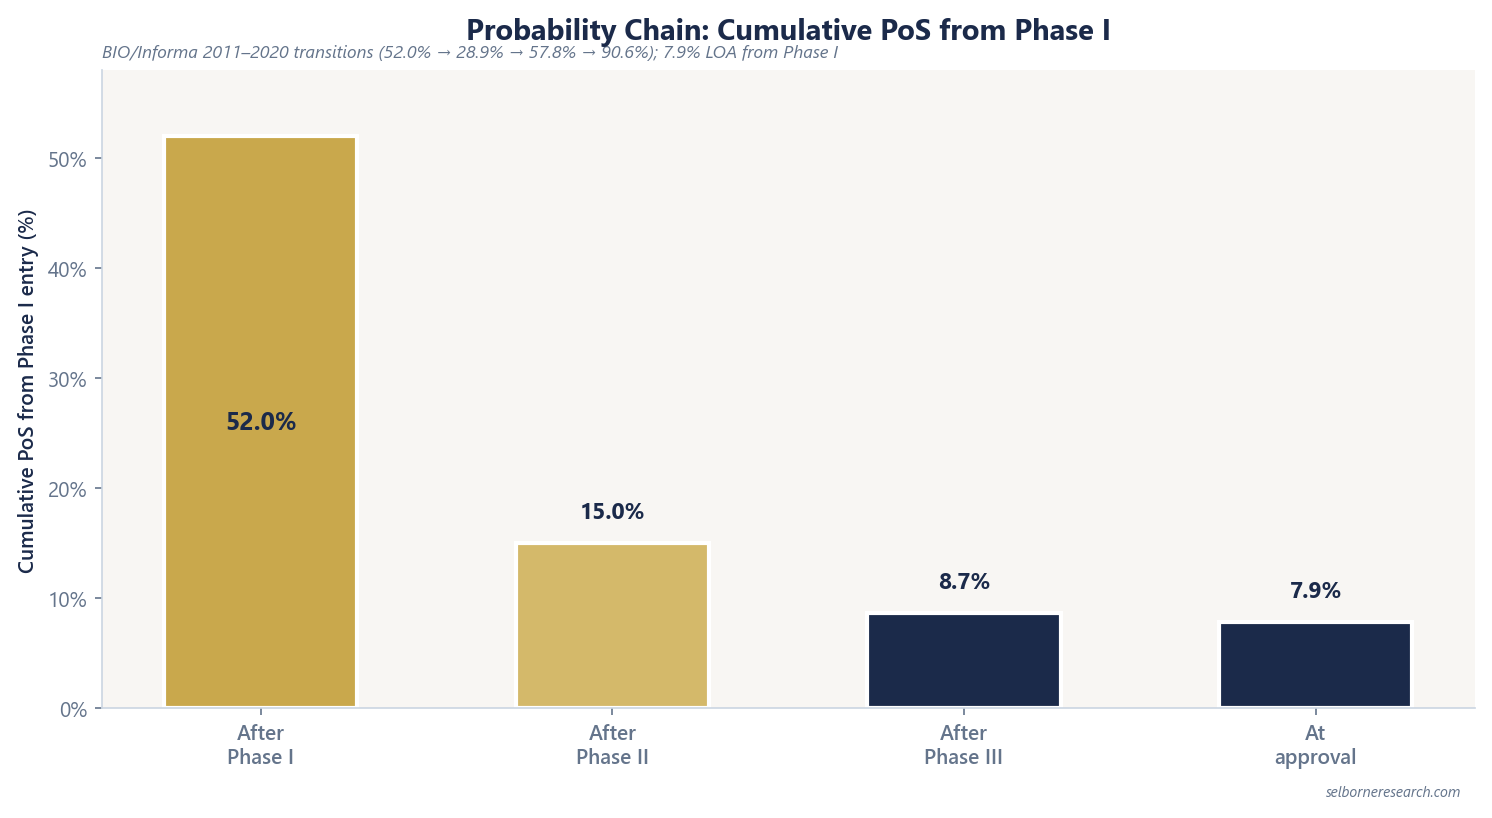
Most programmes are lost early: 85 of the 92 failures happen before Phase III. That is why a candidate’s phase matters so much to its value. A Phase III programme has already survived the gates that stop most drugs, and from there 52.4% reach approval (57.8% × 90.6%), against 7.9% from Phase I. The probability of success guide shows how these odds enter a valuation, and which costs they should and should not weight.
The same study puts the average time from Phase I to approval at 10.5 years.
A Second Dataset: Citeline 2014-2023
Citeline published later rates covering 2014 to 2023 across 10,954 programmes:
| Transition | Rate |
|---|---|
| Phase I → II | 47.3% |
| Phase II → III | 28.0% |
| Phase III → NDA/BLA | 55.0% |
| NDA/BLA → approval | 91.8% |
| Phase I → approval | 6.7% |
The later window is lower at three of the four gates. The guides and models on this site default to the BIO 2011-2020 rates and use Citeline as a lower alternative to test how much the answer moves. Whichever table you pick, use it throughout a valuation.
Rates Vary by Disease Area
The all-indications figures hide a wide spread. In the BIO data, likelihood of approval from Phase I ran from 23.9% in haematology to 3.6% in urology. Clinical trial success rates by therapeutic area sets out each area’s rates and when an area rate should replace the average.
A clinical-stage company's two programmes are valued year by year and its cash rolled forward to first sales, beside a franchise owner valued through its patent cliff.
- 15 sections, the clinical stage ladder to cash runway, multi-programme rNPV and a patent cliff
- 41 pages
- a two-programme clinical-stage company with its runway and dilution, a concentrated franchise owner and a diversified profitable company
- 3 worked companies
- profitable franchise owners and a cash-burner, on filed concentration, cash and burn
- 6-company screen
The Excel model is the primer's rNPV engine live across 13 sheets: a phase-by-phase PoS chain on BIO 2011-2020 rates, from Phase I to Approved; three worked companies, each switchable between clinical and commercial mode and valued year by year over 20 years, with later-phase R&D weighted by the odds of reaching it; a valuation summary with franchise floors; a runway calculator that rolls real cash forward, shows when it runs out if the lead fails, and prices the dilution from the raise; concentration and patent-cliff views; and a sensitivity grid. Change PoS, peak sales, R&D or the discount rate and the value moves.
See what's in the Biotech Sector Primer →£25 PDF · £59 with the Excel model · £159 for all three Healthcare industries
Frequently Asked Questions
- What are the FDA clinical trial phases?
- Under 21 CFR 312.21, Phase 1 is the first use of a drug in people, typically 20 to 80 subjects, and studies how it behaves in the body and its side effects as the dose rises. Phase 2 tests whether it works for a particular condition in no more than several hundred patients. Phase 3 gathers the evidence of effectiveness and safety needed for approval and labelling, usually in several hundred to several thousand subjects. The company then files a New Drug Application (NDA) or Biologics License Application (BLA) for FDA review.
- What is the cumulative probability of approval from Phase I?
- The BIO, Informa and QLS study of 2011 to 2020 gives 7.9%, from phase transition rates of 52.0%, 28.9%, 57.8% and 90.6%. A later Citeline dataset covering 2014 to 2023 gives 6.7%, from 47.3%, 28.0%, 55.0% and 91.8%.
- Which phase transition is the hardest?
- Phase II. Only 28.9% of Phase II programmes moved on to Phase III in the 2011 to 2020 data, and 28.0% in the 2014 to 2023 data. It is usually the first trial designed to show the drug works, and the point where a company decides whether to pay for Phase III.
- How long does it take to get from Phase I to approval?
- The same BIO study puts the average at 10.5 years from Phase I entry to approval for the 2011 to 2020 cohort. Disease areas with higher approval rates tended to have shorter timelines.
Read next
rNPV for Clinical-Stage Biotech
Single-asset rNPV for clinical biotech: PoS-weighted cash flows at 10.0–10.5% discount, a Phase II worked example at 15.1% PoS, equity equals rNPV plus net cash.
Biotech Cash Runway Explained
Cash runway formula for pre-profit biotech: liquidity divided by quarterly operating cash outflow, the 4- and 8-quarter reference points, and why net loss is the wrong denominator.
Clinical Trial Success Rates by Therapeutic Area
Why one industry-wide approval rate misprices pipeline assets: odds of approval by disease area and phase, where each area loses its drugs, and when an area rate should replace the average.
Drug Development Probability of Success
How probability of success enters a drug valuation: the chain from the current phase, why committed trial spend is not weighted, and biologics vs small molecules.
See it applied
These company profiles apply the concepts from this guide to real public companies.