Healthcare · Biotech
Platform vs Single-Asset Biotech
A platform biotech's programmes share one technology, so they tend to fail together. How that changes a company's odds, and when platform value is real.
Selborne Research · Biotech coverage: 7 guides, 6 company profiles, a primer and Excel model
Educational analysis for professional use. This guide is not investment advice or a recommendation to buy or sell any security, and it is not personalised.
On this page
A Platform Is a Bet That One Technology Makes Several Drugs
A platform biotech is valued on a technology it expects to reuse; a single-asset biotech is valued on one lead programme. The difference cuts both ways. Reuse can create value beyond the programmes a company has disclosed, but the shared technology makes those programmes more likely to fail together.
The technology can be a type of molecule, such as messenger RNA or antibodies, a way of delivering a drug into cells, or a discovery engine that generates candidates. The FDA’s own definition, in section 506K of the Federal Food, Drug, and Cosmetic Act, asks for three things: the technology is essential to a drug’s structure or function, it can be adapted to more than one drug sharing common structural elements, and it supports a standardised manufacturing or development process.
A single-asset company may have earlier programmes behind its lead, but the lead carries most of the value. Plenty of companies sit in between. A platform with one advanced programme is, until a second one matures, valued much like a single-asset company.
How the Two Differ
| Single-asset biotech | Platform biotech | |
|---|---|---|
| What carries the value | The lead programme’s approval and sales | The disclosed programmes, plus any the technology has yet to produce |
| How programmes fail | On their own biology | Partly together: a problem with the shared delivery, safety or manufacturing hits every programme that uses it |
| What one trial result tells you | The value of the lead programme | The value of that programme, and something about every other programme on the technology |
| Valuation method | Risk-adjusted NPV (rNPV) of the lead programme plus net cash | Sum of programme rNPVs plus net cash; any value for future programmes as a separate scenario |
The last row is where the argument sits. Both methods start with an rNPV for each programme: its forecast cash flows weighted by the odds of approval, as set out in the rNPV guide. They differ only over what, if anything, to add for programmes that do not yet exist.
Worked Example: Same Odds per Programme, Different Company Risk
Two fictional companies each have three Phase II programmes. Every programme has a 15.1% chance of approval: the Phase II rates from the BIO, Informa Pharma Intelligence and QLS Advisors study of 2011-2020 (28.9% to pass Phase II, 57.8% to pass Phase III and 90.6% at filing) multiplied together.
Company A’s three programmes use unrelated mechanisms, so each succeeds or fails independently. Company B’s three programmes use one technology, and this example takes the extreme case: the programmes share a single failure mode, so they either all work or all fail.
| Outcome | Company A: independent | Company B: one shared failure mode |
|---|---|---|
| No approval | 61.1% | 84.9% |
| Exactly one approval | 32.7% | 0.0% |
| Exactly two approvals | 5.8% | 0.0% |
| All three approved | 0.3% | 15.1% |
| At least one approval | 38.9% | 15.1% |
| Expected approvals | 0.45 | 0.45 |
For Company A, the chance that at least one programme is approved is 1 − (1 − 0.1513)³ = 38.9%. For Company B it stays at 15.1%, because the second and third programmes add no new chance of success: they rise or fall with the first.
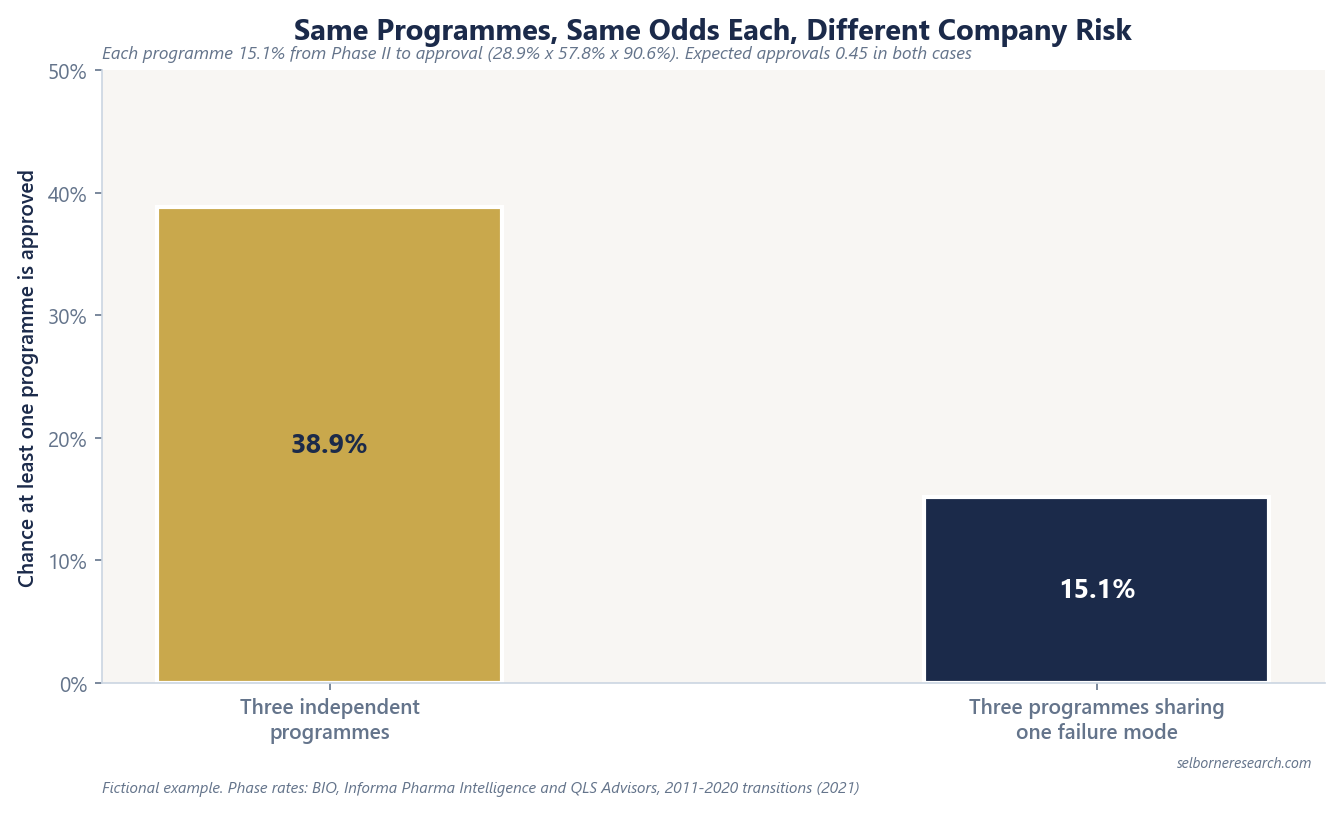
Both companies expect 0.45 approvals, so a sum of programme rNPVs values them the same if the programmes are otherwise alike. What differs is the spread. Company B ends with nothing 84.9% of the time against 61.1% for Company A, and ends with three approvals 15.1% of the time against 0.3%.
Real platforms sit between the two columns. Programmes on one technology share its delivery, manufacturing and safety profile, but each still has to work in its own disease. The all-or-nothing case is useful because it bounds the answer.
Sum of the Programmes First, Platform Value Once Reuse Is Shown
The floor for any pipeline company is the sum of its programmes. Value each disclosed programme with its own phase and, where the sample supports it, its own disease-area success rate. Subtract the present value of overhead no programme carries, and add net cash.
Platform value is the argument over what sits above that floor. A 2025 paper in the Proceedings of the National Academy of Sciences argues that single-asset valuation methods miss what platforms add, such as reusing data and processes across products. That value only exists once reuse happens, so it is conditional. Model it as a scenario with its assumptions visible: how many future programmes, entering at what phase, at what probability, sharing which of the lead programme’s risks.
There is no standard platform premium to apply as a shortcut. A premium applied as a multiple hides the assumptions a scenario forces into the open, and it usually misses the correlation above. If the lead programme fails for a reason the technology shares, the future programmes in the scenario lose value too.
What FDA Platform Designation Does and Does Not Do
Congress created platform technology designation in section 2503 of the PREVENT Pandemics Act (part of Public Law 117-328), which added section 506K to the Federal Food, Drug, and Cosmetic Act. The FDA published draft guidance on it in May 2024.
A technology is eligible only if it is already part of an approved drug, with preliminary evidence that it can be used in more than one drug without harming quality, manufacturing or safety. Once designated, the sponsor can reuse data about the platform in later applications, and the FDA may act to expedite the development and review of later drugs that use it.
Designation does not approve those later drugs. Each still needs its own application and its own evidence that it works. For a valuation, designation shows that the technology has already produced one approved product and may make the next ones cheaper and quicker to develop. It is not a probability of approval, and it does not replace a programme-by-programme rNPV.
What Platform Structure Means for a Valuation
Shared technology changes the risk a company carries more than the value of its disclosed programmes. In the example, expected approvals are identical, but the company with one failure mode is far more likely to end with nothing. For a company that funds itself by selling shares, that is the chance it has to raise money after a setback, when terms are worst. The cash runway guide covers how long the money lasts.
A trial result also carries information about the programmes that share its technology. If one programme fails for a reason common to the platform, the probabilities on its siblings should fall with it; if the technology clears a hurdle, they can rise. A model that holds every programme’s rate fixed after a sibling’s result is internally inconsistent.
Count the programmes, their phases, and whether the technology has already produced more than one approved product. Even then, revenue can rest on one product, which the franchise concentration guide measures.
Platform or single asset, value starts with each programme. The primer values a two-programme clinical company year by year, with risked R&D, overhead and runway.
- 15 sections, the clinical stage ladder to cash runway, multi-programme rNPV and a patent cliff
- 41 pages
- a two-programme clinical-stage company with its runway and dilution, a concentrated franchise owner and a diversified profitable company
- 3 worked companies
- profitable franchise owners and a cash-burner, on filed concentration, cash and burn
- 6-company screen
The Excel model is the primer's rNPV engine live across 13 sheets: a phase-by-phase PoS chain on BIO 2011-2020 rates, from Phase I to Approved; three worked companies, each switchable between clinical and commercial mode and valued year by year over 20 years, with later-phase R&D weighted by the odds of reaching it; a valuation summary with franchise floors; a runway calculator that rolls real cash forward, shows when it runs out if the lead fails, and prices the dilution from the raise; concentration and patent-cliff views; and a sensitivity grid. Change PoS, peak sales, R&D or the discount rate and the value moves.
See what's in the Biotech Sector Primer →£25 PDF · £59 with the Excel model · £159 for all three Healthcare industries
Frequently Asked Questions
- What is the difference between a platform biotech and a single-asset biotech?
- A single-asset biotech's value rests mainly on one lead programme. A platform biotech's rests on a technology it expects to reuse across several drugs, such as a type of molecule, a delivery method or a discovery engine. The platform can add value beyond the programmes it has disclosed, but because those programmes share one technology they tend to succeed or fail together.
- Is there a standard valuation premium for platform biotechs?
- No. There is no authoritative fixed premium for platform companies. Value the disclosed programmes one by one with a risk-adjusted NPV, add net cash, and treat anything for future programmes as a separate, stated scenario: how many programmes, at what phase, with what probability. That extra value is only credible once the technology has produced more than one successful product.
- What does FDA platform technology designation do?
- Set up under section 506K of the Federal Food, Drug, and Cosmetic Act, it lets a sponsor reuse data about a designated technology in later applications, and allows the FDA to expedite development and review of later drugs that use it. A technology qualifies only once it is part of an approved drug. Designation does not approve the next drug; each still needs its own application. The FDA published draft guidance on the programme in May 2024.
Read next
rNPV for Clinical-Stage Biotech
Single-asset rNPV for clinical biotech: PoS-weighted cash flows at 10.0–10.5% discount, a Phase II worked example at 15.1% PoS, equity equals rNPV plus net cash.
Biotech Franchise Concentration
Lead-franchise revenue share for biotech: Vertex cystic fibrosis 92.9%, Gilead HIV 70.5%, Moderna COVID 93.1%; growing versus shrinking franchises and partnership booking traps.
Biotech Cash Runway Explained
Cash runway formula for pre-profit biotech: liquidity divided by quarterly operating cash outflow, the 4- and 8-quarter reference points, and why net loss is the wrong denominator.
See it applied
These company profiles apply the concepts from this guide to real public companies.