Healthcare · Biotech
Clinical Trial Success Rates by Therapeutic Area
Approval odds from Phase I ran from 3.6% to 23.9% across disease areas in 2011-2020. Where the spread comes from and when to swap the average for an area rate.
Selborne Research · Biotech coverage: 7 guides, 6 company profiles, a primer and Excel model
Educational analysis for professional use. This guide is not investment advice or a recommendation to buy or sell any security, and it is not personalised.
On this page
The 7.9% Average Hides a Six-Fold Spread
A drug entering Phase I had a 7.9% chance of reaching FDA approval in 2011-2020, averaged across every disease area. Split by disease area, the same measure ran from 3.6% in urology to 23.9% in haematology. A risk-adjusted NPV (rNPV), which weights a drug’s forecast cash flows by its odds of approval, goes wrong if it applies the average to every asset. It overstates the typical cancer programme’s odds by about half, and gives the typical blood-disorder programme a third of the odds its area’s record supports.
The measure is likelihood of approval (LOA): the share of programmes at a given phase that went on to win FDA approval. It is built from four phase-transition rates: for each phase, the programmes that advanced divided by those that advanced or were suspended by their sponsor. LOA from Phase I is the four rates multiplied together. A suspension counts as a failure whatever prompted it, so a programme dropped for business reasons lowers a rate as much as one that missed its endpoint. The phase guide covers what each phase tests.
The figures come from Clinical Development Success Rates 2011-2020, published in February 2021 by BIO, Informa Pharma Intelligence and QLS Advisors. It counts 12,728 phase transitions in 9,704 programmes at 1,779 companies.
Approval Odds by Disease Area, 2011-2020
| Disease area | LOA from Phase I | LOA from Phase II | LOA from Phase III | Transitions counted |
|---|---|---|---|---|
| Haematology | 23.9% | 34.4% | 71.5% | 352 |
| Metabolic | 15.5% | 25.0% | 55.7% | 399 |
| Infectious disease | 13.2% | 22.8% | 59.4% | 1,170 |
| Other areas | 13.0% | 20.5% | 53.0% | 541 |
| Ophthalmology | 11.9% | 16.6% | 46.7% | 415 |
| Autoimmune | 10.7% | 19.3% | 61.4% | 1,305 |
| Allergy | 10.3% | 18.3% | 64.7% | 201 |
| Gastroenterology (excluding IBD) | 8.3% | 17.8% | 51.9% | 186 |
| All indications | 7.9% | 15.1% | 52.4% | 12,728 |
| Respiratory | 7.5% | 13.5% | 61.6% | 501 |
| Psychiatry | 7.3% | 13.8% | 51.4% | 442 |
| Endocrine | 6.6% | 15.2% | 57.1% | 887 |
| Neurology | 5.9% | 12.3% | 46.0% | 1,411 |
| Oncology | 5.3% | 10.8% | 43.9% | 4,179 |
| Cardiovascular | 4.8% | 9.6% | 45.6% | 651 |
| Urology | 3.6% | 8.8% | 58.6% | 88 |
Ranked by LOA from Phase I. Transitions counted are those behind the Phase I figure. Other areas groups dermatology, renal, obstetrics, non-autoimmune rheumatology, ENT/dental and orthopaedics; gastroenterology excludes inflammatory bowel disease. Source: BIO, Informa Pharma Intelligence and QLS Advisors (2021), Figure 5b.
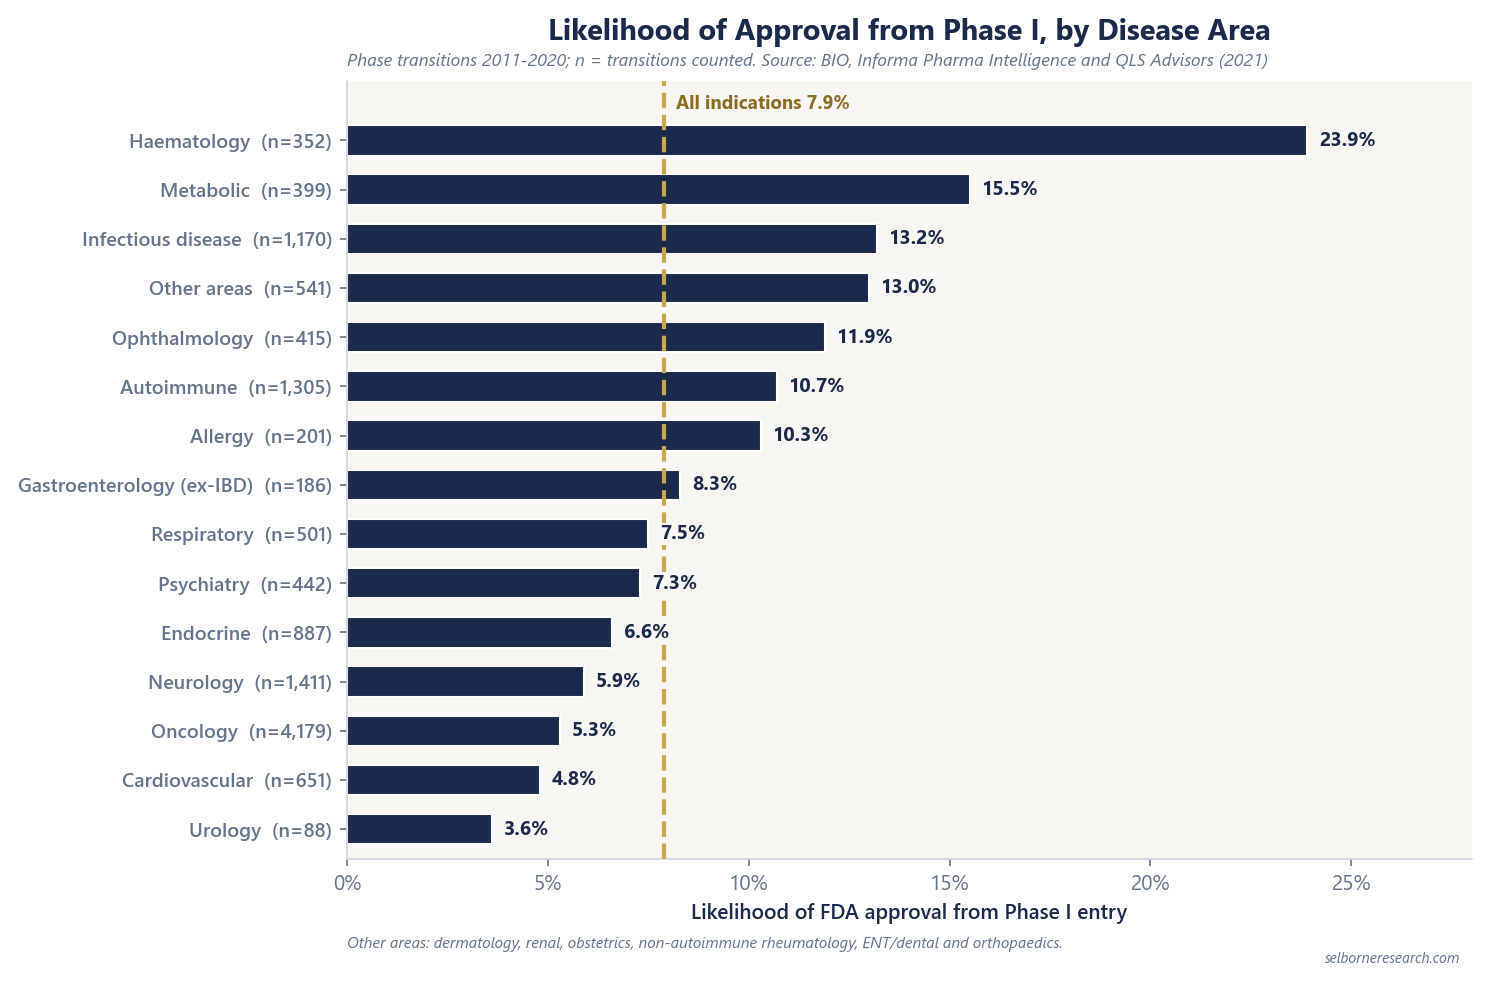
The order changes with the asset’s starting phase. Respiratory, endocrine and urology sit below the average from Phase I but above it from Phase III, because their programmes that survive Phase II go on to do well. Ophthalmology goes the other way: above average from Phase I, below it from Phase III.
Phase II Decides Most of the Spread
Phase II had the lowest success rate of the four phases in every disease area. It also varies most between areas: 48.1% in haematology against 15.0% in urology, a ratio of about three. No other phase varies by more than 1.8 times from best area to worst, so the Phase II rate does most of the work in separating a high-LOA area from a low one.
| Disease area | Phase I to II | Phase II to III | Phase III to filing | Filing to approval |
|---|---|---|---|---|
| Haematology | 69.6% | 48.1% | 76.8% | 93.1% |
| Metabolic | 61.8% | 45.0% | 63.6% | 87.5% |
| Ophthalmology | 71.6% | 35.5% | 51.2% | 91.1% |
| All indications | 52.0% | 28.9% | 57.8% | 90.6% |
| Neurology | 47.7% | 26.8% | 53.1% | 86.7% |
| Oncology | 48.8% | 24.6% | 47.7% | 92.0% |
| Cardiovascular | 50.0% | 21.0% | 55.2% | 82.5% |
| Urology | 40.9% | 15.0% | 69.2% | 84.6% |
Filing means submission of a new drug application (NDA) or biologics licence application (BLA) to the FDA. Source: BIO, Informa Pharma Intelligence and QLS Advisors (2021), Figure 2.
After Phase II, each area has its own second hurdle. Oncology loses more drugs in Phase III than any other area, where 47.7% advance, yet 92.0% of its filings are approved. Cardiovascular has the weakest step at the FDA, with 82.5% of filings approved. Ophthalmology has the best Phase I rate of any area at 71.6%, then a below-average Phase III, which is why its lead shrinks the later the asset starts.
Haematology has the best Phase II and Phase III rates and the second-best Phase I rate. That consistency, more than any single step, puts it three times above the average.
Small Samples and Broad Labels Limit the Precision
Every area gets one decimal place, but the samples behind the figures differ by a factor of more than forty. Urology’s 3.6% rests on 88 transitions, only 13 of them in Phase III. Allergy’s 100.0% approval rate at filing rests on 20. At that size one programme more or less moves a rate by several points, so a small area’s figure is a rough guide at best.
Oncology has the opposite problem. Its 4,179 transitions are a third of the dataset, so its rate is precise, but it averages very different drugs. Immuno-oncology programmes, which work by directing the immune system at a tumour, reached approval from Phase I 12.4% of the time, against 5.3% for oncology as a whole.
Disease area is also only one way to cut the data. The same report finds 17.0% from Phase I for rare-disease programmes, 5.9% for chronic high-prevalence diseases, and 15.9% for programmes that select patients with a biomarker test. An asset can sit in a low-LOA disease area and a high-LOA subgroup at once.
The cohort matters too. A later Citeline study of 2014-2023 puts the all-indications LOA from Phase I at 6.7%. Every disease-area figure on this page is from the 2011-2020 report; setting an area rate from one study against an average from another compares two different sets of programmes.
When a Disease-Area Rate Should Replace the Average
Use the area rate when the asset’s indication sits clearly inside one area and that area has a large sample. Take it from the asset’s current phase: a Phase II oncology asset carries the 10.8% LOA from Phase II, not the 5.3% from Phase I.
A fictional Phase II programme shows the size of the choice. If approval were certain, its cash flows would be worth $1,000M today. Development costs are left aside here to isolate the probability; a full rNPV weights them too.
| Rate applied | LOA from Phase II | Risk-adjusted value |
|---|---|---|
| Oncology | 10.8% | $108M |
| All indications | 15.1% | $151M |
| Haematology | 34.4% | $344M |
If the programme is a cancer drug, the average inflates its value by 40%. If it treats a blood disorder, the average leaves out more than half of it: $151M against $344M. Nothing else in the calculation changed.
Keep the average, or blend it with the area rate, when the area’s sample is small or the indication straddles two areas. Say which rate was used and why.
What Disease-Area Rates Mean for a Valuation
A risk-adjusted value is proportional to the probability of approval: double the rate and the commercial value doubles. So the base rate is the first number in a pipeline valuation to justify, ahead of peak sales.
A disease-area rate describes the class. What is known about the programme itself moves the probability up or down from there: a mechanism already proven in another drug, biomarker selection, or the strength of its Phase II data. State that adjustment as a number in the probability. Adding a clinical-risk premium to the discount rate on top of a probability counts the same risk twice.
For a company with programmes in several areas, each programme takes its own area’s rate. One rate applied across the whole pipeline repeats the blended-average error at company level, and the probability-of-success guide shows how those programme probabilities then combine in a valuation.
A disease-area rate is one input. The primer chains phase rates into a probability of success, then values a clinical-stage company and a franchise owner.
- 15 sections, the clinical stage ladder to cash runway, multi-programme rNPV and a patent cliff
- 41 pages
- a two-programme clinical-stage company with its runway and dilution, a concentrated franchise owner and a diversified profitable company
- 3 worked companies
- profitable franchise owners and a cash-burner, on filed concentration, cash and burn
- 6-company screen
The Excel model is the primer's rNPV engine live across 13 sheets: a phase-by-phase PoS chain on BIO 2011-2020 rates, from Phase I to Approved; three worked companies, each switchable between clinical and commercial mode and valued year by year over 20 years, with later-phase R&D weighted by the odds of reaching it; a valuation summary with franchise floors; a runway calculator that rolls real cash forward, shows when it runs out if the lead fails, and prices the dilution from the raise; concentration and patent-cliff views; and a sensitivity grid. Change PoS, peak sales, R&D or the discount rate and the value moves.
See what's in the Biotech Sector Primer →£25 PDF · £59 with the Excel model · £159 for all three Healthcare industries
Frequently Asked Questions
- Which therapeutic area has the highest clinical trial success rate?
- Haematology. In the BIO, Informa Pharma Intelligence and QLS Advisors study of phase transitions from 2011 to 2020, 23.9% of haematology programmes entering Phase I went on to FDA approval, on 352 transitions. Metabolic disease came next at 15.5% and infectious disease at 13.2%. The average across all disease areas was 7.9%, and urology was lowest at 3.6%.
- What is the probability of approval for an oncology drug?
- In the 2011-2020 data, 5.3% of oncology programmes entering Phase I reached FDA approval, against 7.9% for all disease areas. From Phase II the figure was 10.8%, from Phase III 43.9%, and 92.0% of oncology filings were approved. Immuno-oncology did better than oncology as a whole, at 12.4% from Phase I.
- In which phase do most drugs fail?
- Phase II. It had the lowest success rate of the four phases in every disease area in the 2011-2020 data: 28.9% on average, ranging from 15.0% in urology to 48.1% in haematology. Phase II rates differ about threefold between the best and worst area, far more than any other phase, so Phase II drives most of the gap in overall approval odds.
- Should an rNPV use a disease-area success rate or the industry average?
- Use the disease-area rate from the asset's current phase when the indication sits clearly inside one area and that area has a large sample, as oncology, neurology and autoimmune do. Keep the average, or blend the two, where the sample is small or the asset straddles categories. Either way, keep the probability in the cash flows rather than adding clinical risk to the discount rate.
Read next
Clinical Trial Success Rates by Phase
FDA phase definitions and BIO/Informa success rates: 52.0% to 28.9% to 57.8% to 90.6%, cumulative 7.9% LOA from Phase I; the later Citeline 2014–2023 data give 6.7%.
rNPV for Clinical-Stage Biotech
Single-asset rNPV for clinical biotech: PoS-weighted cash flows at 10.0–10.5% discount, a Phase II worked example at 15.1% PoS, equity equals rNPV plus net cash.
Drug Development Probability of Success
How probability of success enters a drug valuation: the chain from the current phase, why committed trial spend is not weighted, and biologics vs small molecules.
See it applied
These company profiles apply the concepts from this guide to real public companies.
Also in Biotech
- Biotech Cash Runway Explained
- rNPV for Clinical-Stage Biotech
- Clinical Trial Success Rates by Phase
- Biotech Franchise Concentration
- Biotech Partnership Economics
- Clinical Trial Success Rates by Therapeutic Area
- Platform vs Single-Asset Biotech