Healthcare · Pharmaceuticals
Pharma Revenue Concentration Risk
Largest-product revenue share as a risk screen: FY2025 ranking from Pfizer Eliquis 12.7% to Lilly tirzepatide 56.0%, with 25–30% and 40% concentration screens.
Selborne Research · Pharmaceuticals coverage: 7 guides, 6 company profiles, a primer and Excel model
Educational analysis for professional use. This guide is not investment advice or a recommendation to buy or sell any security, and it is not personalised.
On this page
One Drug Can Carry the Whole Company
Concentration is the simplest pharma risk measure: largest-product revenue divided by total revenue. Above 25–30%, one event on that drug moves the whole company: a patent expiry, a safety label change, or a Medicare price set under the Inflation Reduction Act (IRA), which lets Medicare negotiate prices on older drugs. Above 40%, the company’s value rests mainly on one product’s patent calendar and on whether new drugs can replace it.
The ratio says where to look, not what a company is worth. Above 40%, model that product’s loss of exclusivity (LOE), when generics or biosimilars may enter, as its own line. A diversified group such as Pfizer or Johnson & Johnson raises different questions from a franchise that is still growing fast.
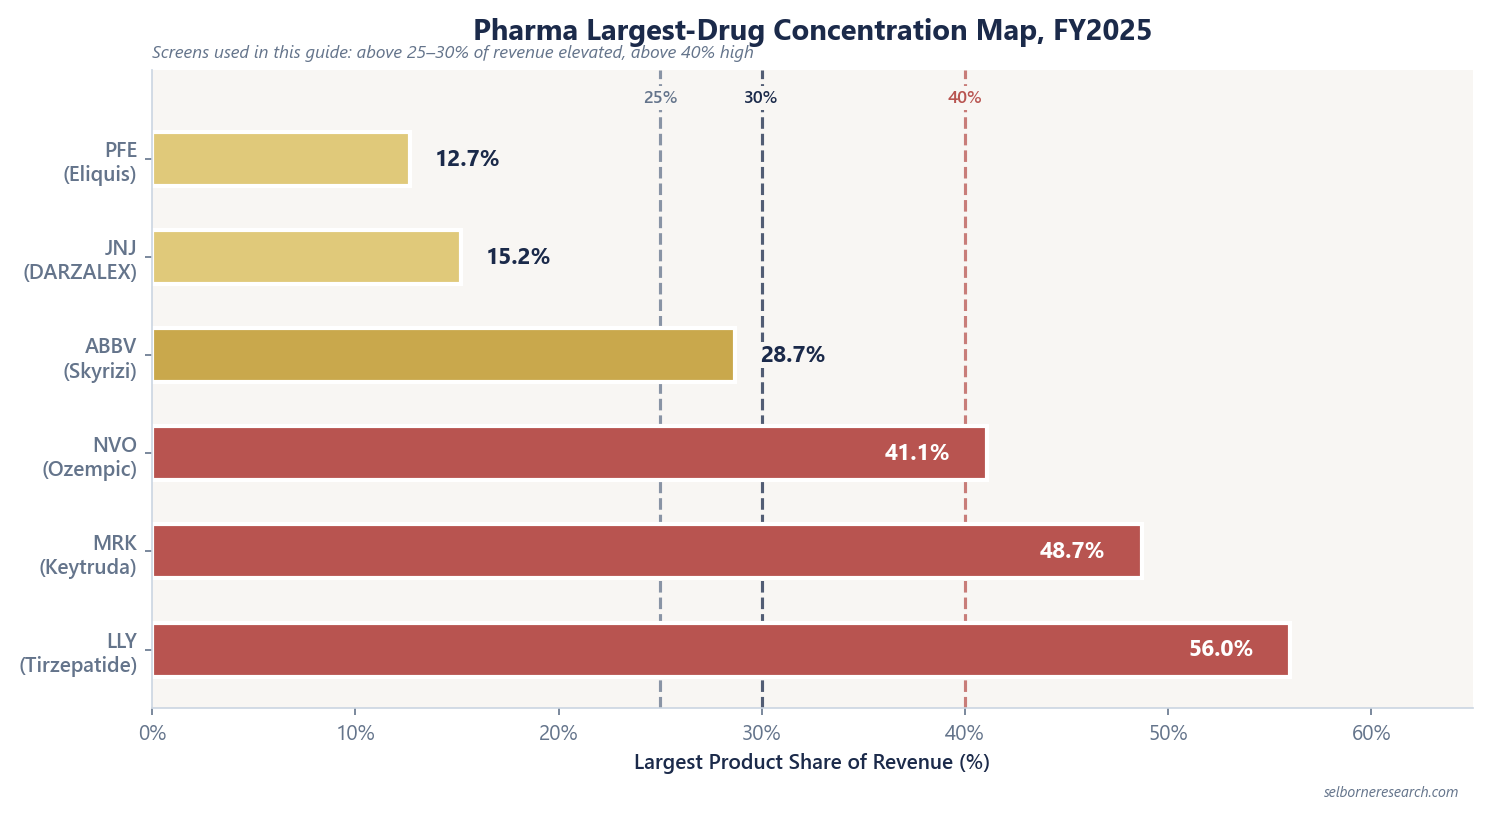
FY2025 Largest-Product Share, Six Filers
| Company | Largest product (what it treats) | Share of revenue | Screen |
|---|---|---|---|
| Pfizer | Eliquis (blood clots), $7,961M | 12.7% | Diversified |
| Johnson & Johnson | DARZALEX (blood cancer) | 15.2% | Diversified (group incl. medtech) |
| AbbVie | Skyrizi (psoriasis, Crohn’s), $17,562M | 28.7% | Elevated |
| Novo Nordisk | Ozempic (diabetes) | 41.1% | High |
| Merck | Keytruda (cancer), $31,680M | 48.7% | High |
| Eli Lilly | Tirzepatide: Mounjaro + Zepbound (diabetes, weight loss) | 56.0% | High |
Novo’s 41.1% counts Ozempic alone. Semaglutide, the molecule inside Ozempic and two other Novo brands, was 73.9% of FY2025 net sales (DKK 309,064M). At Lilly, Mounjaro alone was 35.2%; the tirzepatide franchise was 56.0% of $65,179M.
Concentration Screens
| Band | Threshold | How to use it |
|---|---|---|
| Elevated | Largest drug >25–30% | Date the LOE calendar; AbbVie’s Skyrizi at 28.7% sits here |
| High | Largest drug >40% | Model LOE and payer action explicitly; Merck, Novo’s Ozempic line, Lilly’s tirzepatide |
Screens are starting points. AbbVie also carries Rinvoq (13.6%) and a fading Humira (7.4%), so its immunology business rests on two growing products. Johnson & Johnson’s 15.2% DARZALEX share sits below the 25% line, but STELARA (~6.5%), another psoriasis and Crohn’s drug, faces biosimilars, and the group has a MedTech business the pure drugmakers lack.
A Growing Franchise and a Dated Cliff Read Differently
Growing. Lilly’s tirzepatide at 56.0% and Novo’s semaglutide at 73.9% are high because demand for GLP-1 drugs, the diabetes and obesity class both belong to, is growing faster than everything else they sell. Their near-term patent exposure is smaller. At Lilly, ~20.6% of revenue sits in Trulicity (diabetes), Jardiance (diabetes and heart failure) and Verzenio (breast cancer), which face a mix of patent expiries and IRA prices. At Novo it is ~2.2%: semaglutide’s sales in China, where its compound patent ends in 2026. Novo’s older diabetes and obesity drugs, Victoza and Saxenda (2.0%), have already lost protection. The risks to the growth drugs are supply, competition and new pill forms.
A dated cliff. Merck’s Keytruda, at 48.7%, loses compound patent protection in December 2028 (possibly extended into 2029) and expects an IRA Medicare price from January 2029: the clearest single-product cliff of the six. AbbVie has already absorbed Humira biosimilars (US revenue down 62% from 2022 to 2024, per its 10-Ks) while Skyrizi and Rinvoq refill the portfolio.
Pair every concentration reading with a forecast of that product’s sales after LOE and its dated events in the patent expiry calendar.
Worked Example: A Keytruda Revenue Stress
Merck FY2025 total sales: $65,011M. Keytruda: $31,680M (48.7%).
If Keytruda revenue fell 50% with no offset (an illustrative stress, not a forecast), group sales would drop about 24% from that product alone. A peer whose largest product is 15% of sales would lose about 7.5%. Costs would not fall as fast: Merck’s operating margin was ~32.6% (computed from filed components) with R&D at 24.3% of sales, so profit would fall faster than sales unless new drugs replace Keytruda.
See the Merck research profile for LOE dates and pipeline context.
Dividends and Concentration
Concentration and GAAP payout are separate questions. Lilly pays out 26.1% with 56.0% of revenue in tirzepatide. Pfizer’s ~126% GAAP payout comes from amortisation and write-downs; its largest drug, Eliquis, is only 12.7%. The GAAP payout trap guide explains why. For cliff exposure, start with concentration and LOE dates, then cash flow, then payout.
A base business, a drug at its patent cliff, a growing biologic and a Phase III asset, each valued year by year and summed to value per share.
- 15 sections, the patent ladder to a year-by-year sum-of-parts valuation and concentration screens
- 39 pages
- a small molecule at its cliff, a biologic growth driver and a pipeline asset weighted by its phase, plus a base business
- 3 drug schedules
- large-cap innovators on filed product concentration and loss-of-exclusivity dates
- 6-company screen
The Excel model is the primer's sum-of-parts valuation live across 13 sheets: a base-business DCF at an 8.5% WACC; three drug schedules, each set to marketed or pipeline and to a clinical phase that sets its odds; loss-of-exclusivity cliffs that settle on a generic floor; a calendar-year input that turns a filed patent date into a schedule year; the consolidated bridge to value per share; and patent-cliff, concentration and sensitivity views. Change a drug's LOE year, phase or peak sales, or the WACC, and the value moves.
See what's in the Pharmaceuticals Sector Primer →£25 PDF · £59 with the Excel model · £159 for all three Healthcare industries
Frequently Asked Questions
- What is pharma revenue concentration risk?
- Revenue concentration risk measures how much of a company's sales depend on a single drug or franchise. Largest-product revenue divided by total revenue is the standard screen. When one product dominates, a patent expiry, safety signal or payer decision on that product moves the whole company.
- What concentration levels worry equity analysts?
- The screens used in this guide flag largest-drug share above 25–30% of revenue as elevated concentration and above 40% as high concentration. FY2025 filings put Merck Keytruda at 48.7%, Novo semaglutide at 73.9%, and Lilly tirzepatide at 56.0%, all above the high band.
- Is high concentration always bad?
- Not during a franchise ramp. Tirzepatide and semaglutide concentrations are rising because GLP-1 demand is growing faster than the rest of the portfolio. The same metric on Keytruda, ahead of its loss of exclusivity (LOE) in December 2028, reads as cliff risk instead.
- How does concentration interact with patent cliffs?
- High concentration magnifies a patent expiry. Merck has ~48.7% of FY2025 sales in Keytruda, whose compound patent protection ends from December 2028. Lilly's 56.0% tirzepatide share is protected by a 2036 U.S. compound patent, but ~20.6% of its revenue sits in products facing patent expiry or Medicare price-setting sooner. Pair the concentration screen with a dated forecast of each big product's sales loss.
Read next
Patent Cliffs and LOE Erosion
How loss-of-exclusivity erodes branded drug revenue: generic unit-share curves, net-price erosion by competitor count, biosimilar contrast via Humira, and a worked fade on a $3,000M brand.
The Pharma GAAP Payout Trap
Why Pfizer ~126% and AbbVie ~276% GAAP dividend payout ratios mislead: non-cash charges on acquired assets, one-off gains, and how to test pharma dividends against cash.
Pharma Patent Expiry Dates by Company
Patent and IRA Medicare price dates from six large drugmakers' filings, product by product: where the dates sit in a 10-K, what settled generic entry means, and why one revenue-at-risk figure misleads.
Biotech Franchise Concentration
Lead-franchise revenue share for biotech: Vertex cystic fibrosis 92.9%, Gilead HIV 70.5%, Moderna COVID 93.1%; growing versus shrinking franchises and partnership booking traps.
See it applied
These company profiles apply the concepts from this guide to real public companies.