How to Value a Copper Mine: NAV and the Copper Price
Reserve-based NAV for a copper mine: building the life-of-mine profile, the long-term copper price, the discount rate, and by-products as their own price line.
Educational analysis for professional use. This guide is not investment advice or a recommendation to buy or sell any security, and it is not personalised.
A Copper Mine Is an Ore Body, Not an Earnings Stream
A copper mine is valued on what its reserve will produce over its life, discounted to today. A multiple of this year’s earnings misses most of it. The reason is structural: the ore body depletes, grade falls as the best rock is mined first, and a large slice of the value sits in years that a trailing EBITDA multiple cannot see. Two mines earning the same EBITDA today can be worth very different amounts if one has eight years of reserve left and the other has twenty-five.
So the tool is a reserve-based net asset value (NAV): the life-of-mine cash flows, year by year, discounted at a rate that reflects where the mine sits and how far off the cash is. A multiple has its place as a sanity check against peers, but it is the cross-check, not the valuation. Get the NAV right and the multiple tells you whether the market agrees; start with the multiple and you have skipped the analysis.
Building the NAV, Year by Year
The NAV is assembled from the reserve statement outward. Each step is a line in the model, and each is a place the valuation can go wrong.
| Step | What it is | Where it bites |
|---|---|---|
| Production profile | Payable copper per year, from reserves × grade × recovery × mining rate | Grade declines over life; back-end years are lower |
| Revenue | Payable copper × long-term copper price | The price assumption dominates everything below it |
| By-product revenue | Gold, moly, silver as their own price lines | Netting them into cost hides a second commodity bet |
| Operating cost | Mining, processing, site G&A, treatment and refining charges | This is C1 territory; see the copper cost curve |
| Sustaining capital | The capex to keep the mine producing | A bare cash cost leaves this out; NAV cannot |
| Discount rate | The rate that turns future cash into today’s value | Jurisdiction and stage set it; see mining discount rates |
The discipline is that the NAV is only as honest as its production profile. A flat-line “average year” repeated across the mine life flatters the answer, because it ignores the grade decline and the sustaining capital that cluster in later years. Build the real profile from the reserve statement, or you are valuing a mine that does not exist.
The Copper Price Is the Whole Ball Game
The single largest driver of a copper mine’s NAV is the copper price, and it is the one input analysts are most tempted to fudge by anchoring to today’s screen. Our copper planning price is $11,000/t, about $4.99/lb (worked examples use demonstration prices; check the current copper price when modelling). The point of a planning price is that it is deliberately conservative and held steady, so the NAV is not a bet on the current spot level lasting.
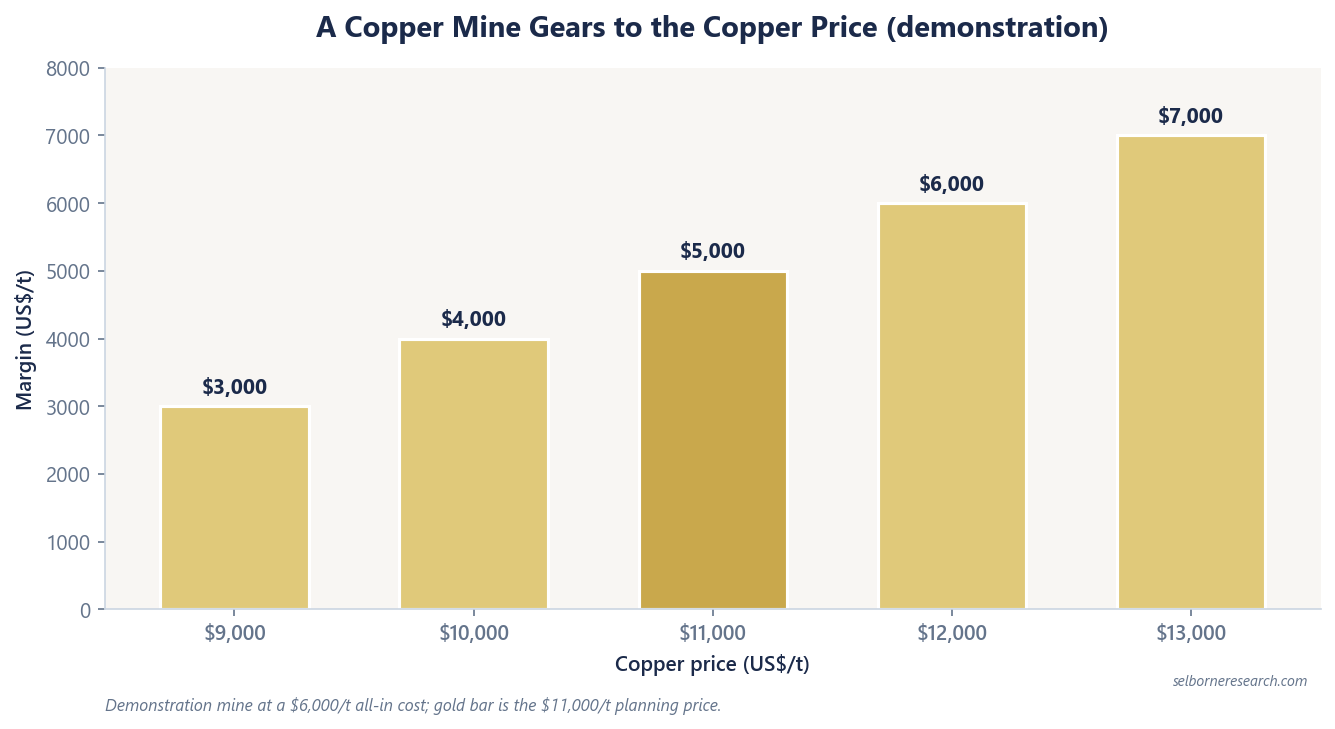
Run the copper price as the primary sensitivity axis, because a copper mine’s NAV is highly geared to it: the cost base is largely fixed, so a change in the price falls almost entirely to the margin, and then compounds through the discounted life. A demonstration mine producing 150,000 tonnes a year at an all-in cost of $6,000/t earns roughly $5,000/t of margin at an $11,000/t price; a 10% move in the copper price, to $12,100/t, lifts that margin by about 22%. That gearing is why the price assumption, not the discount rate, is the number to argue about first.
The Discount Rate: Jurisdiction and Stage
The discount rate turns future cash into a present value, and for a copper mine it carries two things: the time value of money and the risk that the mine does not deliver as planned. A producing mine in a stable, mining-friendly jurisdiction takes a lower rate than a half-built project in a country with a history of tax changes or permit disputes. The full jurisdiction framework is in the mining discount rates guide; the point here is that the rate is a decision, not a default, and applying one house rate to every copper mine regardless of where it sits and how far along it is will misprice the risky ones and the safe ones in opposite directions.
Stage matters as much as geography. A mine in production has resolved most of its construction and ramp risk; a development project still carries the risk that capital costs overrun and the ramp slips, both of which push real value years to the right. That is why a development copper project is discounted harder than a producing one even in the same country, and why a single NAV headline for a pre-production asset should always be read with its discount rate and its remaining capital in view.
By-Products Are a Second Commodity Bet
Most large copper mines pour gold or molybdenum alongside the copper, and the way to model that is as its own price line, not a credit buried in the cost. The reason is risk, not tidiness. A mine that looks cheap to run only because a rich gold credit has been netted off its cost is running two commodity bets at once, and the netted-cost presentation hides the second one. Model the gold at its own price, with its own sensitivity, and the NAV shows how much of the value actually depends on the gold price rather than the copper price. That is the same distinction the copper cost curve draws between a gross and a net cost, carried through into the valuation.
What the NAV Still Misses
A reserve-based NAV values the reserve, and a copper mine is usually worth more than its current reserve alone. Resources that are not yet reserves, exploration ground around the mine, and the option to expand the mill all sit outside the life-of-mine model, and a producing mine with a long history of converting resources to reserves deserves some credit for continuing to do so. Equally, the NAV assumes the plan is delivered, so it does not by itself price the operational risk that a mine underperforms its own profile.
So treat the NAV as the disciplined core of the valuation, not the whole of it: it is the number that a copper price, a discount rate and a reserve statement produce together, and every one of those three has to be stated for the answer to mean anything. The value beyond the reserve is a judgement laid on top, argued separately, never folded silently into the discount rate.
A copper NAV is only as good as the price and discount rate behind it. The primer builds the multi-period engine end to end.
The Excel model is the primer's two NAVs live across 12 sheets: change the gold price, ramp or discount rate and the valuation moves.
Frequently Asked Questions
- How do you value a copper mine?
- On a reserve-based net asset value (NAV): build the life-of-mine production profile from the reserve statement, multiply each year's payable copper by a long-term copper price, subtract that year's operating and sustaining-capital costs, add by-product revenue as its own line, and discount the resulting cash flows at a jurisdiction-appropriate rate. The mine is inventory that depletes, so EV/EBITDA and spot-price multiples travel poorly across grade and mine life. NAV against a through-cycle copper price is the primary method; a multiple is a cross-check, not the answer.
- What copper price should you use to value a copper mine?
- A long-term, through-cycle price, not spot. The copper price is the single largest driver of a copper mine's NAV, and a valuation run at a hot spot price will look cheap on any measure while it lasts. Pick a deliberately conservative planning price, hold it flat or on a defined path across the mine life, and then run the copper price as the primary sensitivity axis. A NAV quoted without the price assumption behind it is not a valuation you can use.
- How do by-product credits affect a copper mine's value?
- A copper mine that also produces gold, molybdenum or silver earns revenue from those metals, and how you model it changes both the headline cost and the NAV's risk profile. Model each by-product as its own price line rather than netting it into a single cost figure. Netting hides the fact that the by-product revenue carries its own price risk: a mine that looks low-cost only because of a high gold credit is really running two commodity bets, and burying the gold in the cost line disguises that.