Cenovus Energy (CVE)
Cenovus research profile covering oil sands, downstream refining, integrated cash flows and Canadian energy valuation.
Educational analysis for professional use. This profile is not investment advice or a recommendation to buy or sell any security, and it is not personalised.
Snapshot
Business Overview
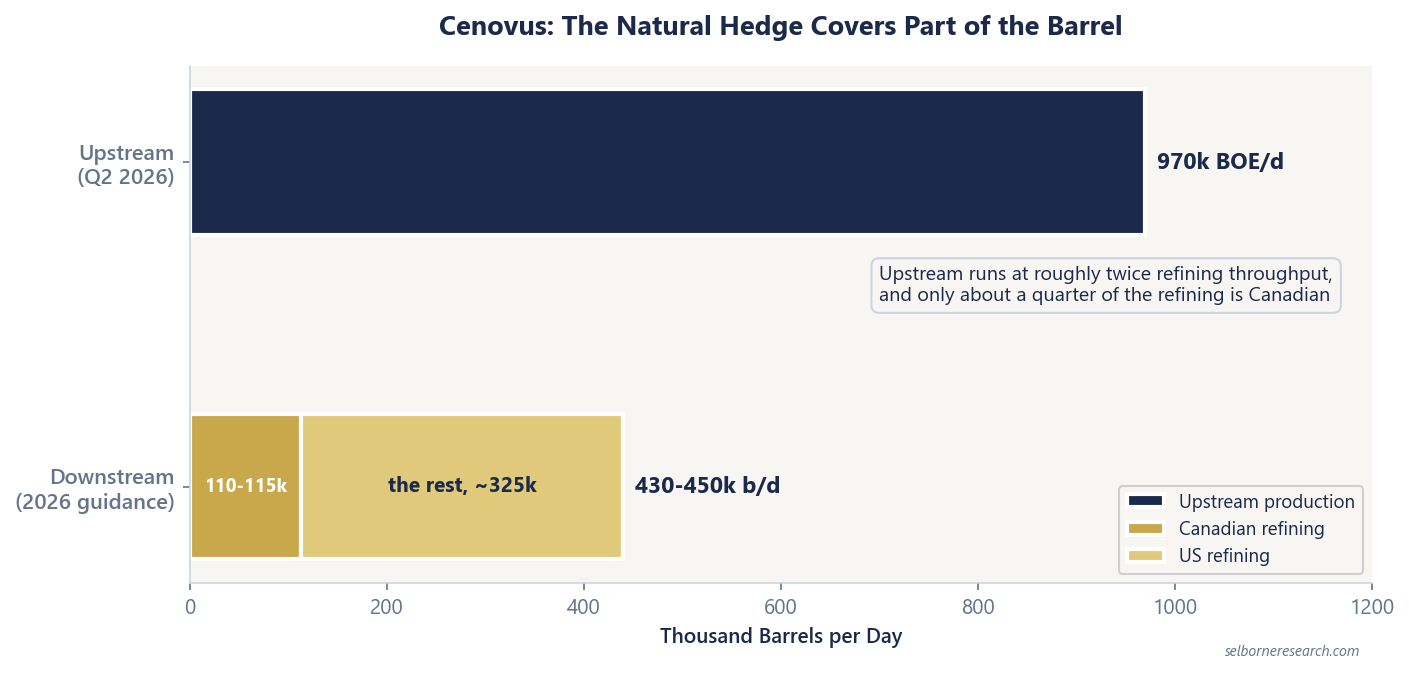
Cenovus is usually described as a natural hedge, and it is one, but only for part of the barrel. The company produces heavy Alberta crude and also owns refineries that buy heavy crude, so a wider discount on Western Canadian Select hurts the producing side and helps the refining side. The offset is real and it is partial: upstream volumes run roughly twice refining throughput, and the refineries that gain most are in the United States rather than Canada.
Upstream, the weight sits in Alberta oil sands, which ran 786,400 BOE/d in Q2 2026: Christina Lake at 372,100 bbls/d, Foster Creek at 214,500, Sunrise at 65,700, and the Lloydminster thermal and heavy oil properties making up the rest. A Conventional segment of natural gas and liquids adds another 118,200 BOE/d. Offshore, Cenovus operates White Rose in the Atlantic with a 60% working interest and holds 34% of Terra Nova, and runs an Asia Pacific business of about 51,200 BOE/d, mostly the Liwan gas fields off southern China (49%) plus two Indonesian gas fields. That totals 970,400 BOE/d for the quarter, and guidance for the year was raised to 970-1,010K BOE/d.
Downstream, five plants give roughly 473 kb/d of capacity: Lima in Ohio at 170 kb/d, Toledo also in Ohio at 160 kb/d, the Lloydminster Upgrader in Saskatchewan at 78.5 kb/d, Superior in Wisconsin at 44 kb/d, and the Lloydminster asphalt refinery. Cenovus sold its half of WRB Refining in Q3 2025. Guidance for 2026 is 430-450K b/d of crude throughput at 91-95% utilisation. Note the split: only 110-115K b/d of that is Canadian refining, so the great majority of the downstream system sits south of the border.
The MEG Deal
Cenovus closed the MEG Energy acquisition on 13 November 2025, paying about C$3.44 billion in cash, issuing 143.9 million shares, assuming roughly C$800 million of net debt, and having already spent C$752 million buying 25 million MEG shares in the market beforehand. MEG brought around 110K bbls/d of in-situ production from a plant that sits next to Cenovus's own Christina Lake, which is the point of the deal: two adjacent SAGD operations can share pads, wells and infrastructure in a way two distant ones cannot.
That adjacency is what the synergy target rests on. Management guides to roughly C$150 million a year in the near term, rising above C$400 million a year from 2028, from well-pad optimisation, shared drilling and supply-chain consolidation. About C$120 million of the first C$150 million was reported in place by February 2026. Whether the C$400 million arrives on schedule is one of the bigger open questions for the stock.
What to Watch in the Financials
Cenovus needs both legs modelled. Upstream alone or downstream alone gives you a misleading answer, because the two respond to the same price move in opposite directions. Start with a DACF framework (debt-adjusted cash flow) run at a conservative price case: our planning deck uses WTI at US$70/bbl, a WCS differential of -US$15/bbl and a US Gulf Coast 3-2-1 crack of US$25/bbl, all set below spot on purpose. The 3-2-1 crack is the refining margin from turning three barrels of crude into two of gasoline and one of distillate. Full-year 2025 delivered C$8.9 billion of adjusted funds flow. The first half of 2026 delivered about C$8.4 billion, almost the whole of the prior year in six months, on the enlarged production base. Management says the capital programme and the base dividend hold at a US$45/bbl WTI price.
Where the hedge actually works. When the WCS discount to WTI widens, Alberta heavy crude fetches less and upstream cash flow falls. Refineries configured to run heavy crude buy that same barrel cheaper and earn more. Cenovus owns both ends, so the swing is damped rather than cancelled. What limits it is where the refining sits. Canadian refining is only 110-115K b/d of the 430-450K b/d system, so most of the offset is earned by the Ohio and Wisconsin plants paying a delivered US price, not by Canadian ones buying near the wellhead. Track the operating margin each segment reports, not upstream realisations alone.
WCS differential trajectory. Trans Mountain's expansion came online in May 2024 and narrowed the WCS-WTI discount from the $15-20/bbl range that preceded it to roughly $10-12/bbl since. Cenovus is the pipeline's largest shipper, with 144K b/d committed, close to a quarter of the capacity the expansion added. A tighter discount helps upstream and shrinks the refining offset, which is the hedge running the other way. Model the discount widening back out as the line fills and Canadian production grows; management expects that within two to three years, and our planning deck already sits at -US$15/bbl for exactly that reason.
MEG integration synergies. Track the near-term C$150 million target against quarterly disclosures, then the step up towards C$400 million by 2028. That step depends on operational changes, consolidating well pads and rationalising service contracts, which take years rather than quarters. Per-barrel operating costs across the enlarged oil sands base will show you whether integration is working before management calls it.
Peer Context
Three names dominate Canadian oil sands: Canadian Natural Resources (CNQ), Suncor Energy (SU), and Cenovus. Each runs a different model.
CNQ is the volume leader, guiding to 1,637-1,682K BOE/d for 2026 and hitting a record 1.68M BOE/d in Q2, with 2026 marking a 26th consecutive year of dividend increases. It is pure upstream, with no refining leg. That makes it the cleaner expression of Canadian heavy oil, and it also means nothing on the balance sheet cushions you when the WCS discount blows out.
Suncor also integrates, but its downstream skews consumer-facing through the Petro-Canada retail network. Its 2026 refining throughput guidance is 460-475K b/d, on a nameplate capacity raised during the year to 511K b/d. Capital returns are aggressive: monthly buybacks stepped up to C$500 million from August 2026, pointing to roughly C$4.7 billion for the year. Read Suncor less as an upstream-versus-downstream hedge and more as a vertically integrated chain that ends at the forecourt.
Cenovus sits between the two. It has the refining offset CNQ lacks and heavier upstream weighting than Suncor's retail-led model. Post-MEG it crossed 970K BOE/d in the second quarter of 2026 and guides above one million for the year, scale only CNQ exceeds among Canadian producers. What you take on in exchange is integration risk neither peer carries, and a balance sheet still working back to its target.
Key Risks
MEG integration execution. Getting from roughly C$150 million of synergies to C$400 million by 2028 means consolidating well pads, merging drilling programmes and cutting overlapping contracts across a 110K bbls/d asset base. All of that involves planned downtime, personnel change and contractor renegotiation. If the ramp slips, or if well productivity at the acquired Christina Lake pads disappoints during the handover, the deal economics erode. This is the most company-specific risk on the register.
Refining margin cyclicality. Refining cracks mean-revert hard, and they have been well above their long-run level. Our planning deck runs the US Gulf Coast 3-2-1 crack at US$25/bbl against a spot 3-2-1 nearer US$37, a deliberate haircut of about a third, because new capacity in the Middle East and Asia keeps arriving. The danger for Cenovus is correlation: if cracks normalise while the WCS discount also stays tight, both legs give up margin at once and the hedge does nothing. The offset only pays when the two move in opposite directions, so model the case where they do not.
Heavy oil transport constraints. Trans Mountain eased the export bottleneck, but the line is expected to approach capacity within a few years as Canadian production grows, and no comparable project is under construction behind it. Crude-by-rail is expensive enough that it only clears at wide discounts. If egress tightens again the WCS discount widens sharply, which helps the refineries and hurts the far larger producing base. On the group's volumes that combination is net negative.
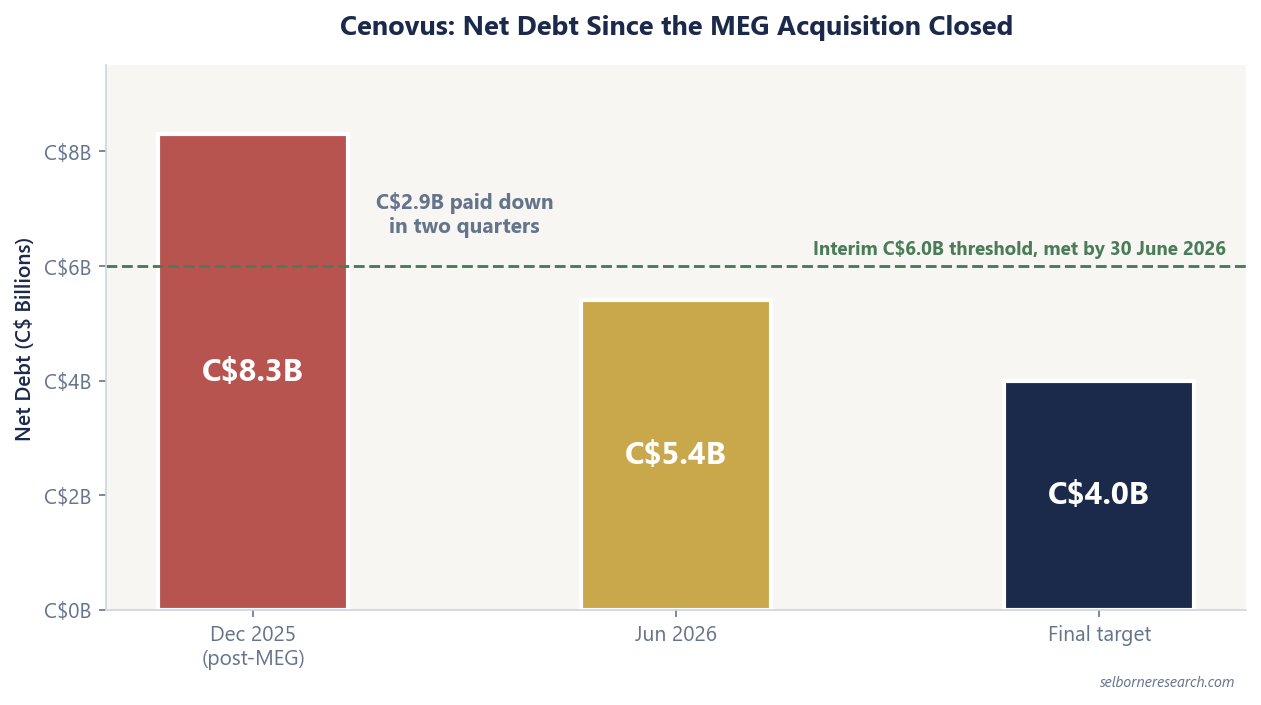
Balance sheet and capital allocation. Net debt was C$8.3 billion at the end of 2025 after the MEG close, against a C$4.0 billion long-term target. It fell to C$5.4 billion by 30 June 2026, C$2.7 billion of that in the second quarter alone, clearing the interim C$6 billion threshold. So the overhang that dominated the story at closing has largely been worked off in two quarters of strong cash flow. The question shifts accordingly: with less debt to pay down, more free cash flow goes to buybacks and dividends, and the balance sheet stops absorbing a downturn on the shareholders' behalf. Watch how fast the split moves.
Two regulatory regimes. Canadian carbon pricing raises the operating cost of every bitumen barrel, and the oil sands are emissions-intensive per barrel relative to lighter crude, so the exposure is above the industry average. The US refineries carry their own environmental and fuels policy risk. Neither is unique to Cenovus, but owning Canadian upstream and mostly American downstream means two rulebooks where a pure-play peer faces one. If you want to test what a higher cost base does to the barrels underwriting all of this, the F&D cost benchmarks guide sets out how the capital side of a barrel is measured.
Cenovus refines the heavy crude it produces, so the legs partly offset. The primer reads that integrated cash flow on EV/DACF.
The Excel model is the primer's reserve-based NAV live across 15 sheets: change the oil price, decline rate or discount rate and the valuation moves.