Chemicals · Industrial Gases
Project Backlog vs RPO in Industrial Gases
A gases backlog counts capital still to spend; RPO counts revenue customers must pay. Why Linde's $10.0bn and $62bn cannot be added, shown on one plant.
Selborne Research · Industrial Gases coverage: 7 guides, 4 company profiles, a primer and Excel model
Educational analysis for professional use. This guide is not investment advice or a recommendation to buy or sell any security, and it is not personalised.
On this page
Backlog Is Spending, RPO Is Revenue
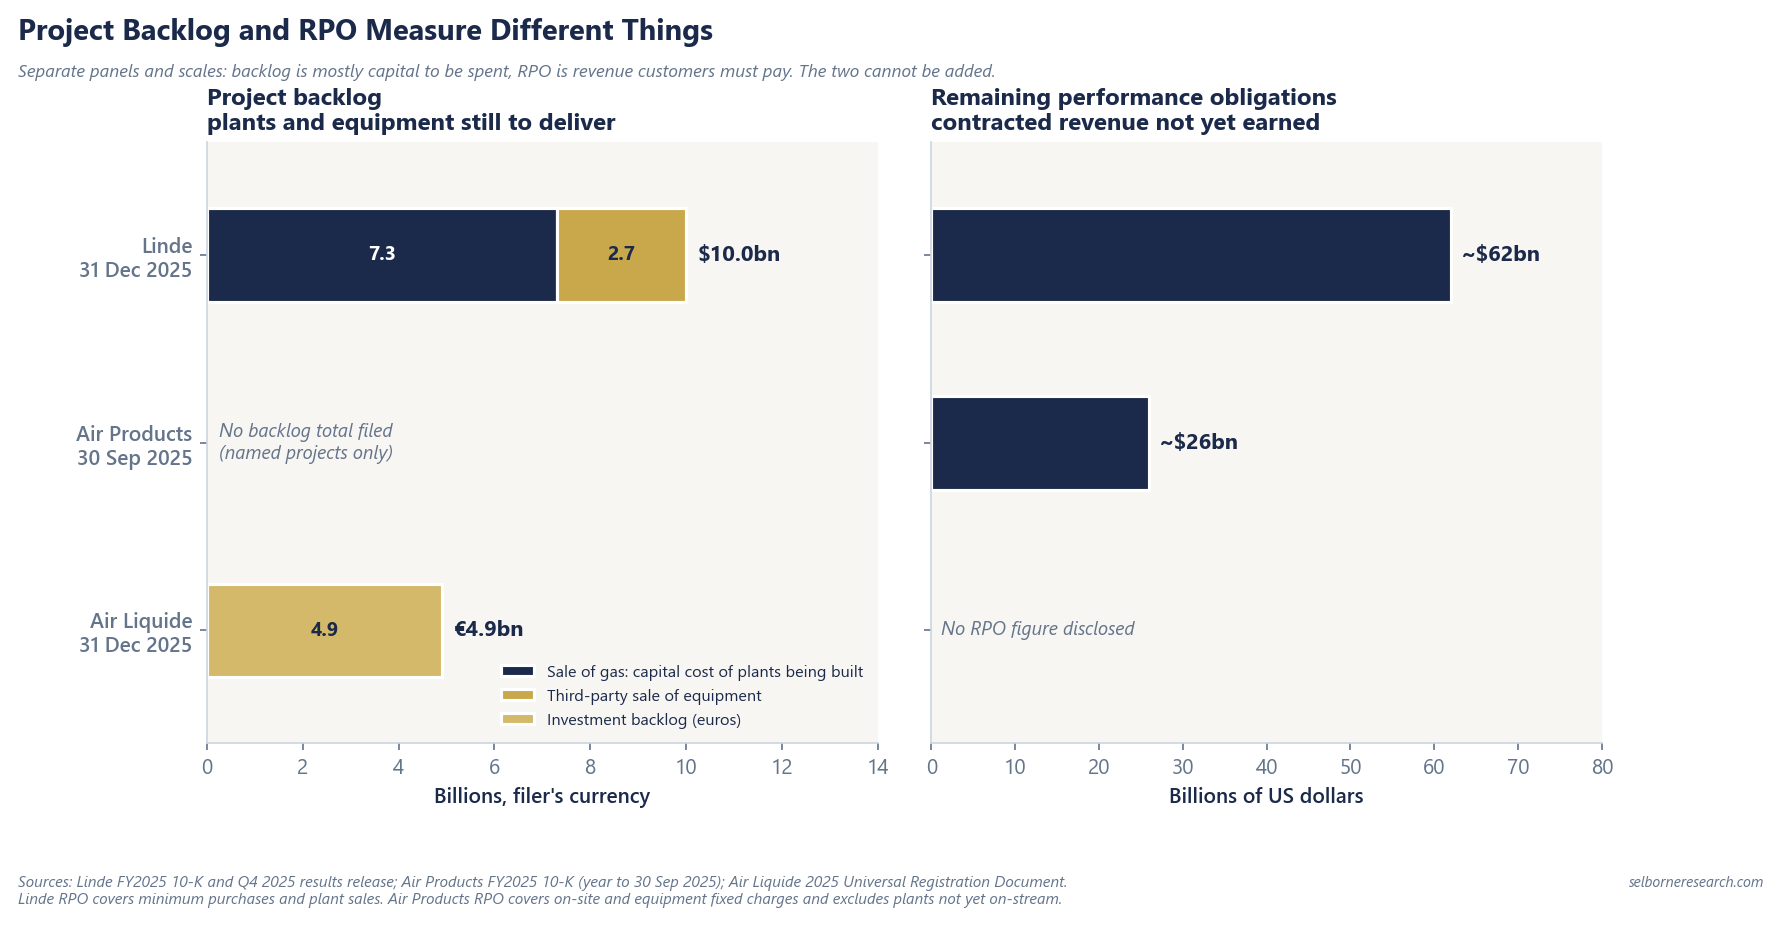
A gases company’s project backlog and its remaining performance obligations sit on opposite sides of the same plants. The backlog mostly counts what the company will spend building plants it has signed for. RPO counts what customers are contracted to pay it over the life of their supply deals. At 31 December 2025 Linde reported a $10.0bn project backlog and $62bn of RPO. Adding them, or reading one as a multiple of the other, mixes a cost with an amount receivable.
Both labels sound like “work still to do”. RPO is an accounting disclosure with a definition set by the revenue standard (ASC 606 in the US, IFRS 15 elsewhere): the contract price allocated to obligations not yet performed. A project backlog has no standard behind it. Each company chooses what goes in, and in industrial gases the answer is mostly capital expenditure.
Five Measures, Defined
| Measure | What it counts | Units and timing | Who files it | Filed figure |
|---|---|---|---|---|
| Remaining performance obligations | Contract price still to be earned: minimum purchases and fixed charges, not volumes above them | Revenue, earned over contracts of up to thirty years | Linde, Air Products | Linde $62bn (31 Dec 2025); Air Products $26bn (30 Sep 2025) |
| Sale-of-gas backlog | Total estimated capital cost of large plants under construction for gas supply contracts | Capital to be spent before start-up | Linde | $7.3bn (31 Dec 2025) |
| Sale-of-equipment backlog | Plants and equipment Linde’s engineering business has contracted to build for third parties | Contract value still to deliver | Linde | $2.7bn (31 Dec 2025) |
| Investment backlog | Investments in projects decided but not yet started, gross, excluding subsidies | Capital to be spent | Air Liquide | €4.9bn (31 Dec 2025) |
| 12-month investment opportunities | Projects under negotiation where a decision is expected within twelve months | Capital, gross; not yet signed | Air Liquide | €4.6bn (31 Dec 2025) |
Sources: Linde FY2025 10-K and Q4 2025 results release; Air Products FY2025 10-K, year to 30 September 2025; Air Liquide 2025 Universal Registration Document.
What RPO Counts, and What It Leaves Out
RPO counts only what a customer cannot avoid paying. For an on-site plant, one built at or beside the customer’s site and supplying it by pipeline, that means the minimum purchase or fixed monthly charge written into the contract. Linde says its figure excludes all on-site sales above the minimums, “which can be significant depending on customer needs”. A plant running at full load bills more than its RPO share implies.
The two filers that publish RPO draw its edges differently:
- Plant sales. Linde’s figure includes fixed-price plant sales by its engineering business as well as gas minimums. Air Products’ figure covers fixed charges on its on-site and sale-of-equipment contracts, with no dollar split between the two.
- Plants not yet running. Air Products excludes expected revenue from new on-site plants that are not yet on-stream. Linde’s note states no such exclusion.
- Energy. Air Products leaves out variable amounts it bills as it goes, including energy costs passed through to customers, so its RPO holds none of the power bill its customers will eventually pay.
- Timing. Linde expects about half of its minimum-purchase revenue within six years, and Air Products about half of its RPO within five.
On the same definition, Linde’s RPO was $59bn at 30 September 2024. The take-or-pay guide explains the contract floor that RPO measures.
What a Project Backlog Counts
A gases project backlog mostly counts capital. Linde’s 10-K defines its sale-of-gas backlog as “the total estimated capital cost of large plants under construction”. That is money Linde will pay out to build plants whose customers have contracted to buy the gas.
Linde’s headline backlog adds a second, different number: the third-party sale-of-equipment backlog of Linde Engineering, which is the value of plants it is building for other companies to own. That part is revenue Linde will book, and plant sales also sit inside its RPO. So the headline blends capital Linde spends with contract value it earns, and part of it overlaps with the RPO figure.
Air Liquide’s investment backlog is cleaner, because it counts only capital. The 2025 Universal Registration Document defines it as the cumulative value of investments for projects decided but not yet started, gross and excluding subsidies, covering growth projects above a size threshold and leaving out renewals, maintenance, safety and efficiency spending. A project enters when the investment committee approves it and the customer signs, and stays through a construction phase of 24 to 36 months or more. About 40% of the investment backlog at the end of 2025 was for Electronics customers, the rest mainly Large Industries.
The opportunity book is one step earlier. It counts projects still being negotiated, where a decision is expected within twelve months. Nothing in it is signed. A project leaves when the contract is signed, the customer drops it, a competitor wins it, or the decision slips beyond twelve months.
Air Liquide also gives a rule of thumb for turning capital into sales. At a theoretical capital intensity of 3, meaning €3 invested for each €1 of annual sales, a €150M Large Industries investment should bring about €50M of sales a year once the plant is fully ramped up. That is how a capital backlog relates to revenue: through a ratio and a ramp-up period, never by adding one to the other.
Air Products files neither format. It discloses individual projects and their status, covered on the hydrogen backlog guide, but no backlog total.
One Plant Through Both Measures
Take a fictional supplier that signs a 15-year on-site contract for a 2,000 tonne-a-day air separation unit, a plant that splits air into oxygen, nitrogen and argon, costing $250M. The customer must take at least 85% of capacity: 2,000 t × 365 days × 85% = 620,500 tonnes a year.
The fee that recovers the $250M over 15 years at 7.5%, the return the primer’s model builds into the contract, is $28.3M a year, or $45.64 a tonne on the minimum volume. Discount fifteen payments of $28.3M at 7.5% and they come back to $250M. The fee covers capital only. Energy is passed through to the customer, and operating costs and tax sit on top.
| Stage | Project backlog | RPO, Air Products basis |
|---|---|---|
| Contract signed, construction starts | $250M, the capital to spend | Nil: the plant is not yet on-stream |
| Under construction, two to three years | Falls as the capital is spent | Nil |
| Start-up | Leaves the backlog | $424.8M: $28.3M × 15 years |
| Five years after start-up | Nil | $283.2M: $28.3M × 10 remaining years |
On Linde’s basis, which states no exclusion for plants still being built, the same contract could sit in RPO from signing. In that period one plant appears in both numbers at once.
RPO at start-up is larger than the capital cost because it adds up fifteen payments that include a 7.5% return. It then runs down as each year’s minimum is billed. The $424.8M is also a floor twice over: it holds only the capital-recovery part of the fee, and it ignores any volume the customer takes above 85%.
Add the two and you get $674.8M for one plant: capital the supplier pays out plus revenue the customer owes. The sum describes nothing.
What the Two Numbers Do Not Tell You
RPO is not a revenue forecast. Beyond the exclusions above, it leaves out future price escalation and contracts not yet renewed. Linde lists signings, terminations, renewals, inflation, currency and energy costs among the reasons actual revenue will differ.
A backlog is not a measure of value. A capital backlog tells you how much will be spent. What that spending is worth depends on the fee, the contract length and the cost of running the plant, and those are in no backlog figure. A $250M plant earning a fee that repays it at 7.5% and one earning a fee that repays it at 12% look identical in the backlog.
Neither compares cleanly across filers. The definitions differ as set out above, and Air Products’ year ends on 30 September, the other two on 31 December. A table that ranks the three on either measure is ranking definitions.
Industrial Gases Sector Primer
A backlog adds value through the cash its plants earn. The primer values contracted on-site earnings year by year and carries signed projects as their own line.
- 15 sections, from the three supply modes to a sum-of-the-parts valuation, a downturn test and ROCE against WACC
- 43 pages
- a packaged-and-merchant global leader and an on-site-heavy major
- 2 worked archetypes
- the listed gas majors on filed supply-mode mix, return on capital and backlog
- 4-company screen
The Excel model is the primer's sum-of-the-parts valuation live across 11 sheets: two archetypes (a global leader and an on-site-heavy major), each splitting EBITDA by supply mode, valuing the contracted on-site slice as escalated year-by-year cash flow over the contract plus a renewal value and the cyclical slice on a market multiple, adding a backlog value and deducting net debt; an on-site contract schedule; a supply-mode downturn test; ROCE against WACC; and a live sensitivity grid. Change the on-site share, the contract discount rate or the cyclical multiple and the value moves.
See what's in the Industrial Gases Sector Primer →£25 PDF · £59 with the Excel model · £159 for all three Chemicals industries
Frequently Asked Questions
- What is the difference between project backlog and remaining performance obligations?
- A project backlog in industrial gases mostly counts capital the company will spend building plants it has signed contracts for. Remaining performance obligations (RPO) count revenue customers are contracted to pay, as required by the revenue accounting standard. One is a cost to the supplier, the other an amount owed to it, so the two cannot be added or divided into each other. At 31 December 2025 Linde reported a $10.0bn project backlog and $62bn of RPO.
- What does Linde's remaining performance obligation include?
- Linde's FY2025 10-K puts the consideration from future minimum purchase requirements and plant sales at $62bn at 31 December 2025. It excludes on-site sales above the minimums, which Linde says can be significant. Supply contracts run up to thirty years, and about half of the minimum-purchase revenue is expected within six years.
- Does Air Products' RPO include plants still under construction?
- No. Air Products' FY2025 10-K says its $26bn of RPO excludes expected revenue from new on-site plants that are not yet on-stream, as well as contracts under a year and variable amounts such as energy costs passed through to customers. It covers fixed charges on on-site and sale-of-equipment contracts, without a dollar split between the two.
- What is Air Liquide's investment backlog?
- The cumulative value of investments in projects decided but not yet started, gross and excluding subsidies, for industrial growth projects above a size threshold. A project enters once Air Liquide's investment committee approves it and the customer signs, and stays through construction. It stood at €4.9bn at 31 December 2025. Air Liquide does not disclose an RPO figure.
Read next
Take-or-Pay Contracts in Industrial Gases
AI Large Industries take-or-pay; LIN minimum purchases; APD fixed monthly fees; ~$62bn and ~$26bn RPOs; why wording differs but the cash-flow floor is the same.
Hydrogen and the Clean-Energy Backlog
How four gases majors disclose clean-energy backlog: Linde's $10.0bn total, Air Liquide's €4.9bn, Nippon Sanso's ~32% sustainable share and Air Products' projects and exits.
Industrial Gas Business Models
On-site, merchant and packaged channels; contract lengths and minimum purchases; FY2025 mix contrast (LIN packaged 35% vs APD on-site 52%).
See it applied
These company profiles apply the concepts from this guide to real public companies.