Chemicals · Industrial Gases
Industrial Gas Margins by Company
EBITDA and operating margins at four industrial gas majors, each on its own basis, and why energy billed on at cost moves the percentage but not the profit.
Selborne Research · Industrial Gases coverage: 7 guides, 4 company profiles, a primer and Excel model
Educational analysis for professional use. This guide is not investment advice or a recommendation to buy or sell any security, and it is not personalised.
On this page
Energy Moves the Percentage, Not the Profit
An industrial gas margin moves with energy prices even when profit does not. On-site contracts let the supplier bill its customer for changes in the cost of power and natural gas, so energy runs through revenue and cost of sales in equal amounts. When power gets dearer, revenue rises, profit stays where it was and the margin falls. A table of gases margins therefore ranks two things before it ranks management: how much of each company’s revenue is energy billed on at cost, and how its supply splits between on-site plants, bulk deliveries and cylinders.
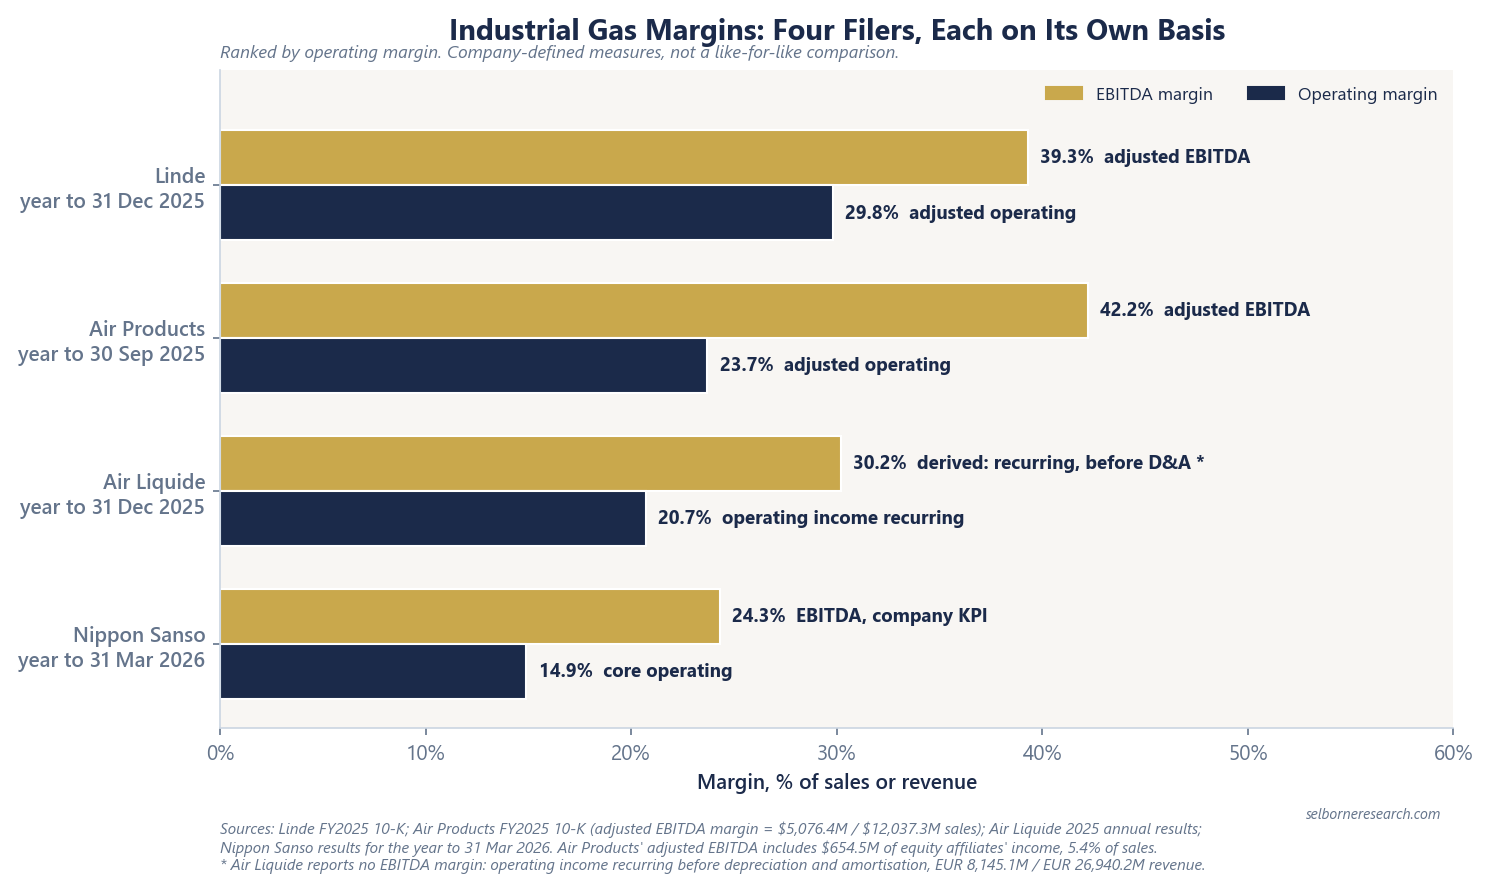
Two measures carry the comparison: EBITDA margin, and operating margin, which is struck after depreciation, a large cost in an industry of long-lived plants. No two of the four majors define either measure the same way, so each figure below stays on its company’s own basis. The business models guide explains the three supply modes.
Four Filers, Each on Its Own Basis
| Company | Year to | EBITDA margin | Operating margin, headline basis | Statutory operating margin | Energy pass-through: filer’s label and effect on sales |
|---|---|---|---|---|---|
| Linde | 31 Dec 2025 | 39.3% adjusted | 29.8% adjusted | 26.3% | “Cost pass-through”: 0% |
| Air Products | 30 Sep 2025 | 42.2% adjusted, our calculation | 23.7% adjusted | (7.3%) | “Energy cost pass-through to customers”: +2% |
| Air Liquide | 31 Dec 2025 | 30.2%, our calculation; none reported | 20.7% recurring | 19.6% | “Energy impact”: +0.8% |
| Nippon Sanso | 31 Mar 2026 | 24.3%, company’s own measure | 14.9% core | 14.6% | “Pass-through & Surcharge”: −0.9% |
Ranked by headline operating margin. Sources: Linde and Air Products FY2025 10-Ks, Air Liquide’s 2025 annual results, Nippon Sanso’s results for the year to 31 March 2026. Adjusted, recurring and core measures remove items each company treats as outside its running business; Linde’s also removes the extra depreciation and amortisation from revaluing Linde AG’s assets in their 2018 merger. Air Products’ 10-K prints adjusted EBITDA of $5,076.4M, not the percentage, so 42.2% is that figure over sales of $12,037.3M. Air Liquide’s 30.2% is its income statement line for operating income recurring before depreciation and amortisation, €8,145.1M, over revenue. The last column is that line’s contribution to the year’s change in sales; Nippon Sanso’s includes surcharges.
What Sits Between the Two Margins
In the table, Air Products leads Linde on EBITDA margin and trails it on operating margin. Two items explain it.
The first is income from joint ventures. Air Products counts its share of equity affiliates’ profit in adjusted EBITDA: $654.5M in FY2025, or 5.4 points of its margin. That income never appears in operating income. Linde’s equivalent was $228M, 0.7% of sales. Strip it out of both and Linde leads on EBITDA too, 38.6% to 36.7%.
The second is depreciation. Air Products charged $1,564.2M, 13.0% of sales; Linde’s adjusted depreciation was 8.8%. Air Products takes 51% of its sales from on-site plants, built at or beside a customer’s site and paid for over a 15-to-20-year contract, so more of each dollar of revenue goes to recovering the cost of the plant. Linde takes 24% from on-site and 35% from cylinders. Supply mix shows most clearly in the gap between the two margins.
The two IFRS filers add a third wrinkle. Air Liquide and Nippon Sanso put lease costs into depreciation, while US accounting keeps operating lease costs above EBITDA at Linde and Air Products. That lifts an IFRS pre-depreciation margin against a US one, by an amount the headline figures do not show.
Statutory margins need a separate warning. Air Products’ FY2025 GAAP operating margin was negative because of $3,747.0M of charges it labels business and asset actions, worth 31.1 points of sales. A year earlier its GAAP margin was 36.9%, lifted by a $1,575.6M gain on selling its LNG business. Neither figure describes the running business, which is why the headline column uses each company’s adjusted measure.
One Plant, Three Energy Prices
Take a fictional on-site plant. It sells $100M a year, of which $40M is energy billed on to the customer at cost, and earns $30M of EBITDA. Then the energy price moves.
| Energy billed on | Revenue | EBITDA | EBITDA margin | Margin at last year’s energy price |
|---|---|---|---|---|
| $20M (price halves) | $80M | $30M | 37.5% | 30.0% |
| $40M (base) | $100M | $30M | 30.0% | 30.0% |
| $80M (price doubles) | $140M | $30M | 21.4% | 30.0% |
Nothing about the plant changed: the customer pays the energy bill and the profit is the same, yet the reported margin spans 16 points. The last column is the fix: restate revenue at last year’s energy price and the margin holds at 30.0%. Air Liquide publishes its margin this way.
How Each Filing Shows the Pass-Through
All four put a pass-through line in the bridge that explains the year’s change in sales. Only two say what it did to the margin.
Linde calls it “cost pass-through”, which its 10-K defines as the contractual billing of energy cost variances, mainly to on-site customers. The line was flat in 2025, so look at years when energy prices swung. In 2022 pass-through added 6% to Linde’s sales and in 2023 it took 3% off, each time “with minimal impact on operating profit”. Its adjusted EBITDA margin rose from 32.6% in 2022 to 36.9% in 2023. Had the lost 3% of sales stayed in, the 2023 margin would have been about 35.8%. So roughly a quarter of the 4.3-point rise came from energy leaving the revenue line. Higher pricing also added 6% to sales that year.
Air Products quantifies the effect. Energy cost pass-through added 2% to its FY2025 sales and $278M to cost of sales. Its 10-K attributes 50 bps of the 70 bps fall in its adjusted operating margin to that pass-through, and 100 bps of a 150 bps fall in its Americas segment margin, where pass-through added 4% to sales. The filing says it plainly: cost pass-through results in declining margins.
Air Liquide goes furthest. Its “energy impact” is the share of sales indexed to energy prices multiplied by the change in the average price, and it is stripped out of comparable growth. In 2025 it added €235M to revenue, 0.8%. The published operating margin, operating income recurring over revenue, rose 80 bps to 20.7%; measured at 2024 energy prices it rose 100 bps to 20.9%.
Nippon Sanso reports “Pass-through & Surcharge” as one line, which took 0.9 points off revenue growth of 3.9% in the year to March 2026. Because surcharges are mixed in, the energy share cannot be separated, and the company does not state a margin effect.
What the Table Does Not Tell You
It is not a ranking of how well each company is run. The figures differ in adjustments, joint-venture income, lease accounting and year end.
Each group margin also blends businesses that are not gases. Linde’s includes an engineering business that earned an 18.1% operating margin on $2,250M of sales in 2025. Air Liquide’s includes Healthcare and Electronics. Equipment and installation made up 43% of revenue in Nippon Sanso’s Japan segment in the year to March 2026.
Read a change in any of these margins against the pass-through line before reading it as a change in the business. At Air Liquide energy hid part of the 2025 improvement; at Air Products it caused most of the FY2025 fall.
Industrial Gases Sector Primer
A margin tells you little until it reaches cash. The primer and model split a gases major by supply mode and stress its merchant share through a downturn.
- 15 sections, from the three supply modes to a sum-of-the-parts valuation, a downturn test and ROCE against WACC
- 43 pages
- a packaged-and-merchant global leader and an on-site-heavy major
- 2 worked archetypes
- the listed gas majors on filed supply-mode mix, return on capital and backlog
- 4-company screen
The Excel model is the primer's sum-of-the-parts valuation live across 11 sheets: two archetypes (a global leader and an on-site-heavy major), each splitting EBITDA by supply mode, valuing the contracted on-site slice as escalated year-by-year cash flow over the contract plus a renewal value and the cyclical slice on a market multiple, adding a backlog value and deducting net debt; an on-site contract schedule; a supply-mode downturn test; ROCE against WACC; and a live sensitivity grid. Change the on-site share, the contract discount rate or the cyclical multiple and the value moves.
See what's in the Industrial Gases Sector Primer →£25 PDF · £59 with the Excel model · £159 for all three Chemicals industries
Frequently Asked Questions
- What EBITDA margin do industrial gas companies earn?
- On each company's own definition, Air Products earned a 42.2% adjusted EBITDA margin in the year to 30 September 2025 and Linde 39.3% in calendar 2025. Nippon Sanso's EBITDA margin, a company KPI, was 24.3% for the year to 31 March 2026. Air Liquide reports no EBITDA margin; the line on its income statement for operating income recurring before depreciation and amortisation comes to 30.2% of 2025 revenue. The definitions differ, so not all of the gap is business.
- Why does energy cost pass-through lower an industrial gas company's margin?
- Because the energy is billed on at cost. On-site contracts let the gas company charge its customer for changes in power and natural gas costs, so revenue and cost of sales rise by the same amount and profit stays put. The same profit over more revenue is a lower percentage. Air Products' FY2025 10-K puts 50 bps of the 70 bps fall in its adjusted operating margin down to higher energy cost pass-through.
- Why is Air Products' EBITDA margin higher than Linde's when its operating margin is lower?
- Two items sit between the margins. Air Products' adjusted EBITDA includes $654.5M of income from equity affiliates, 5.4% of sales, which its operating income leaves out; Linde's equivalent was 0.7% of sales. And Air Products' depreciation was 13.0% of sales against 8.8% on Linde's adjusted basis. Take the equity income out and the EBITDA order reverses: 36.7% at Air Products, 38.6% at Linde.
Read next
Industrial Gas Business Models
On-site, merchant and packaged channels; contract lengths and minimum purchases; FY2025 mix contrast (LIN packaged 35% vs APD on-site 52%).
ROCE and the Gases Oligopoly
Four filers, four definitions of return on capital (LIN 24.2%, AI 11.2%, APD 10.1%, NSHD 7.1%), and why each is read against its own cost of capital.
See it applied
These company profiles apply the concepts from this guide to real public companies.