Chemicals · Industrial Gases
ROCE and the Gases Oligopoly
Four filers, four ROCE definitions (LIN 24.2%, AI 11.2%, APD 10.1%, NSHD 7.1%): why the gap mixes business with accounting, and returns against capital cost.
Selborne Research · Industrial Gases coverage: 7 guides, 4 company profiles, a primer and Excel model
Educational analysis for professional use. This guide is not investment advice or a recommendation to buy or sell any security, and it is not personalised.
On this page
Four Filers, Four Definitions
Every major industrial gas company reports a return on capital, and no two define it the same way. Linde publishes adjusted after-tax return on capital, Air Liquide recurring return on capital employed (ROCE) after tax, Air Products adjusted return on capital and Nippon Sanso ROCE after tax. A gap between two of them mixes business with accounting.
Filed Returns by Company
| Company | Metric (filer definition) | Latest year | Prior year |
|---|---|---|---|
| Linde | Adjusted after-tax ROC | 24.2% (2025) | 25.9% (2024) |
| Air Liquide | Recurring ROCE | 11.2% (2025) | 10.7% (2024) |
| Air Products | Adjusted return on capital | 10.1% (year to Sep 2025) | 11.3% (year to Sep 2024) |
| Air Products | GAAP return on capital | (0.9%) (year to Sep 2025) | 10.8% (year to Sep 2024) |
| Nippon Sanso | ROCE after tax | 7.1% (year to Mar 2026) | 7.2% (year to Mar 2025) |
Air Products’ GAAP figure fell because of $3.7bn of pre-tax charges in FY2025 (2025 annual report).
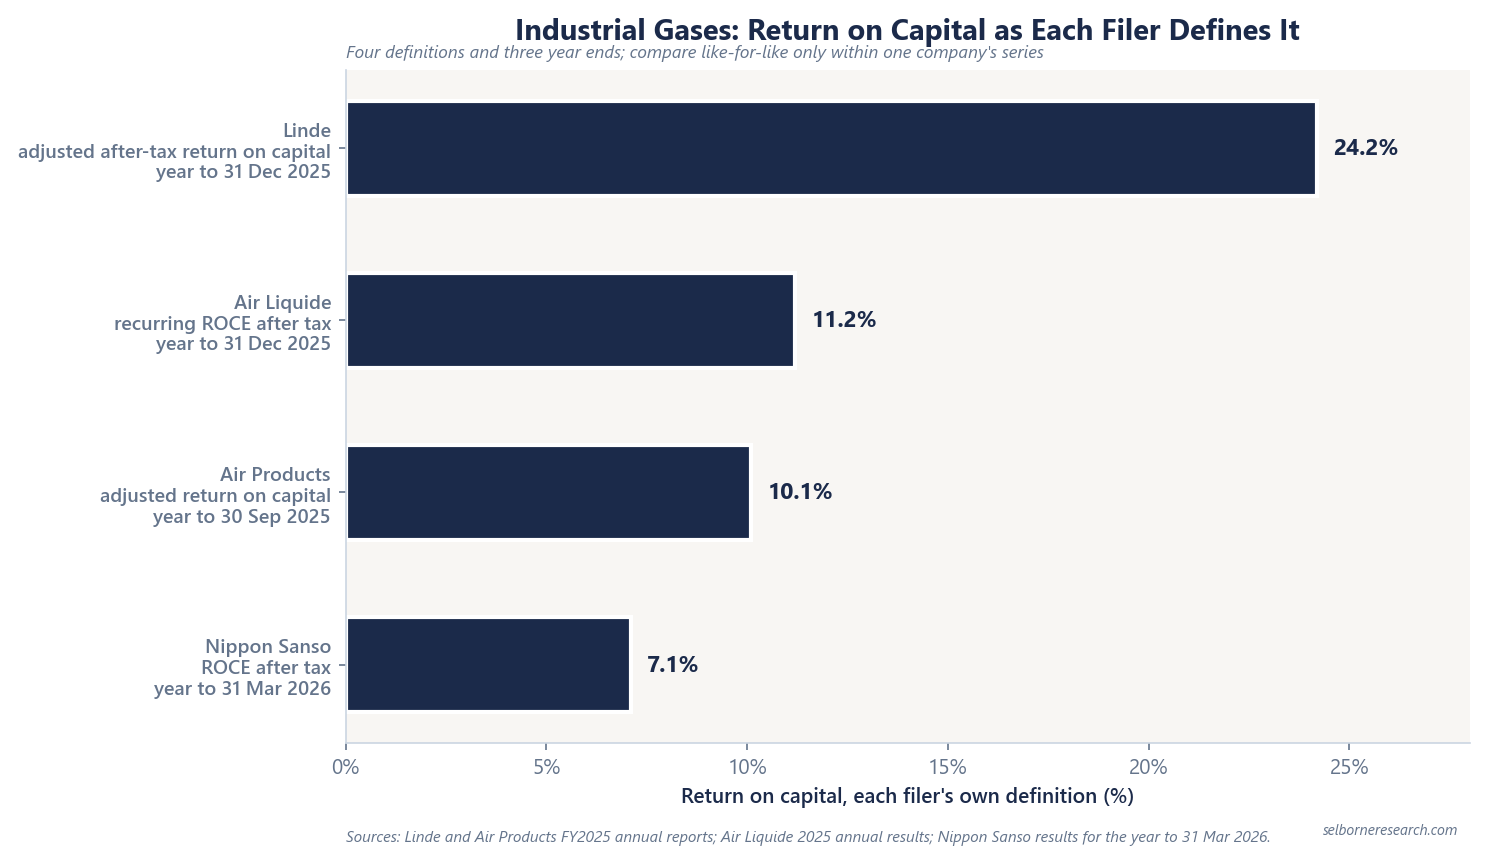
The chart shows reported returns, each on its company’s own definition, so it is not a like-for-like ranking. Adjusted and recurring measures strip out items each company treats as outside its running business, capital is measured differently, and the year ends run from March to December.
What a Return Figure Can and Cannot Tell You
A return on capital means something only against the cost of that capital. A company earning 11% on capital that costs it 8% creates value on every dollar it invests; one earning 11% on capital that costs 12% destroys it. The spread multiplied by invested capital is economic profit.
A return says nothing on its own about what a business is worth: that depends on how long the spread lasts and how much capital the company can put to work at it. That is why the premium valuation guide starts from contracted cash flow.
A Concentrated Market
Linde’s FY2024 and FY2025 10-Ks list Air Liquide, Air Products, Messer and Mitsubishi Chemical (through Nippon Sanso) as global and regional competitors, plus many small local producers and distributors. They also note that customers own a significant share of plants themselves. A few large suppliers and a long tail sit behind these returns, unlike a fragmented commodity market.
Supply mix shapes returns too. Linde’s FY2025 revenue was 24% on-site, 30% merchant and 35% packaged; Air Products’ was 51% on-site and 44% merchant. A larger packaged share ties earnings to delivery density and list-price discipline. A larger on-site share ties them to the take-or-pay floors on individual large plants. The business models guide maps those mixes.
Beyond the Headline Return
Linde earns its return while carrying a $10.0bn project backlog at end-2025, mostly capital for plants that earn nothing until they start up. Its net debt was about 1.6x 2025 adjusted EBITDA.
Air Liquide earns its return from a European-led mix of Large Industries (big plants for single customers) and Industrial Merchant, with more than 9,500 km of pipeline.
Air Products’ adjusted return sits beside a negative GAAP one; read the charges behind the gap as well as the adjusted headline.
Nippon Sanso’s return comes with a larger equipment and installation business than the other three: about a quarter of revenue outside its Thermos consumer arm in the year to March 2026.
Reading a Return Series
Take each figure from the company’s annual report or results release, since data services relabel series. Chart one company per column, with its definition in the label. Then check supply mix and debt: capital spent on plants not yet earning lowers the ratio before the contracts behind them start paying.
Within one filer the definition stays fixed, so the series compares year to year. Linde’s one-year fall in the table, read against Linde’s own cost of capital, says more than any gap between two filers.
Industrial Gases Sector Primer
Contracted on-site cash flow valued year by year with a renewal value, the merchant and packaged slice on a market multiple, a backlog adder and a downturn test.
- 15 sections, from the three supply modes to a sum-of-the-parts valuation, a downturn test and ROCE against WACC
- 43 pages
- a packaged-and-merchant global leader and an on-site-heavy major
- 2 worked archetypes
- the listed gas majors on filed supply-mode mix, return on capital and backlog
- 4-company screen
The Excel model is the primer's sum-of-the-parts valuation live across 11 sheets: two archetypes (a global leader and an on-site-heavy major), each splitting EBITDA by supply mode, valuing the contracted on-site slice as escalated year-by-year cash flow over the contract plus a renewal value and the cyclical slice on a market multiple, adding a backlog value and deducting net debt; an on-site contract schedule; a supply-mode downturn test; ROCE against WACC; and a live sensitivity grid. Change the on-site share, the contract discount rate or the cyclical multiple and the value moves.
See what's in the Industrial Gases Sector Primer →£25 PDF · £59 with the Excel model · £159 for all three Chemicals industries
Frequently Asked Questions
- What ROCE do industrial gas majors report?
- On each company's own definition, for its latest fiscal year: Linde adjusted after-tax return on capital 24.2% (2025); Air Liquide recurring ROCE 11.2% (2025); Air Products adjusted return on capital 10.1% (year to September 2025; its GAAP figure was (0.9%) after $3.7bn of charges); Nippon Sanso ROCE after tax 7.1% (year to March 2026). Never set Linde's adjusted figure beside Air Liquide's recurring one without a note on the definitions.
- How should industrial gas ROCE be compared?
- Within one company's own series, and against that company's cost of capital. The four majors use four definitions and three different year ends, so a gap between two filers mixes business with accounting. The spread of return over the cost of capital, multiplied by invested capital, gives economic profit, which says whether growth adds value.
- Who does Linde name as its competitors?
- Linde's FY2024 and FY2025 10-Ks list Air Liquide, Air Products, Messer and Mitsubishi Chemical (through Nippon Sanso) as global and regional competitors, alongside many small local producers and distributors, and note that customers own a significant share of plants themselves. That concentrated structure is the context for the returns the four filers report.
- Why is Air Products' GAAP return on capital misleading for FY2025?
- GAAP return on capital was (0.9%) against 10.8% a year earlier, while adjusted return on capital was 10.1%. $3.7bn of pre-tax charges for business and asset actions caused the gap, about $2.4bn of it for three US clean-energy projects exited in February 2025. Use the adjusted figure for the trend in the running business; read GAAP for write-down and exit risk.
Read next
Why Industrial Gases Trade at Premium Multiples
Contracted cash flows, pipeline density, oligopoly structure; ~12-16x EV/EBITDA vs commodity chemicals ~6-9x.
Industrial Gas Business Models
On-site, merchant and packaged channels; contract lengths and minimum purchases; FY2025 mix contrast (LIN packaged 35% vs APD on-site 52%).
Industrial Gas Margins by Company
EBITDA and operating margins at four gases majors, each on its own basis, and why energy billed on at cost moves the percentage but not the profit.
ROIC in Specialty Chemicals
Damodaran sector return on capital 10.95% vs WACC 7.25% (+3.70 pp spread); why FY2025 issuer ROIC is absent; how to read the spread.
See it applied
These company profiles apply the concepts from this guide to real public companies.