Real Estate · REITs
REIT Net Debt to EBITDA by Company: 2025 Ranked
Net debt to EBITDA for eighteen US equity REITs at end-2025, from Welltower at 3.03x to BXP at 7.86x, with each company's own definition beside it.
Selborne Research · REITs coverage: 8 guides, 6 company profiles, a primer and Excel model
Educational analysis. This guide is not investment advice or a recommendation to buy or sell any security, and it is not personalised.
On this page
Most Large REITs Sit Between 4x and 6x
At the end of 2025, eighteen large US equity REITs reported net debt to EBITDA between 3.03x and 7.86x. Fifteen of the eighteen sat between 4.1x and 5.7x. Only two were below 4x and one above 6x.
Net debt to EBITDA is borrowing, less cash, divided by a year of earnings before interest, tax, depreciation and amortisation. REITs usually report it on EBITDAre, Nareit’s version, which also strips out gains and losses on property sales. The REIT screening checklist explains how to read the ratio.
Net Debt to EBITDA at 31 December 2025, Ranked
Every figure is the company’s own, from its fourth-quarter 2025 results or supplemental package, filed with the SEC between January and February 2026. None is recalculated.
| Rank | Company | Property type | Net debt / EBITDA | What the company counts |
|---|---|---|---|---|
| 1 | Welltower (WELL) | Health care | 3.03x | Net debt to adjusted EBITDA, Q4 annualised |
| 2 | Sun Communities (SUI) | Manufactured housing | 3.4x | Net debt to trailing twelve-month recurring EBITDA |
| 3 | Camden (CPT) | Apartments | 4.1x | Net debt to annualised adjusted EBITDAre, Q4 |
| 4 | Public Storage (PSA) | Self-storage | 4.2x | Net debt and preferred equity to EBITDA, full year |
| 5 | Equity Residential (EQR) | Apartments | 4.27x | Net debt to normalised EBITDAre, trailing twelve months |
| 6 | Mid-America Apartment (MAA) | Apartments | 4.3x | Net debt to adjusted EBITDAre, trailing twelve months |
| 7 | Rexford Industrial (REXR) | Industrial | 4.4x | Net debt to adjusted EBITDAre, Q4 annualised |
| 8 | AvalonBay (AVB) | Apartments | 4.7x | Net debt to core EBITDAre, Q4 annualised |
| 9 | Digital Realty (DLR) | Data centres | 4.9x | Net debt, with its share of joint-venture debt, to adjusted EBITDA, Q4 annualised |
| 10 | Regency Centers (REG) | Shopping centres | 5.1x | Pro-rata net debt and preferred stock to trailing twelve-month operating EBITDAre |
| 11 | Ventas (VTR) | Health care | 5.2x | Its share of net debt to further adjusted EBITDA |
| 12= | Prologis (PLD) | Logistics | 5.3x | Its share of debt, net of cash, to adjusted EBITDA, Q4 annualised |
| 12= | Invitation Homes (INVH) | Single-family rental | 5.3x | Net debt to trailing twelve-month adjusted EBITDAre |
| 14 | Realty Income (O) | Net lease | 5.4x | Net debt to annualised pro forma adjusted EBITDAre, Q4 |
| 15 | UDR (UDR) | Apartments | 5.5x | Net debt to annualised EBITDAre, adjusted for non-recurring items |
| 16 | NNN REIT (NNN) | Net lease | 5.6x | Net debt to annualised EBITDAre, Q4 |
| 17 | Alexandria (ARE) | Life science | 5.7x | Net debt and preferred stock to adjusted EBITDA, Q4 annualised |
| 18 | BXP (BXP) | Office | 7.86x | Its share of net debt to its share of EBITDAre, Q4 annualised |
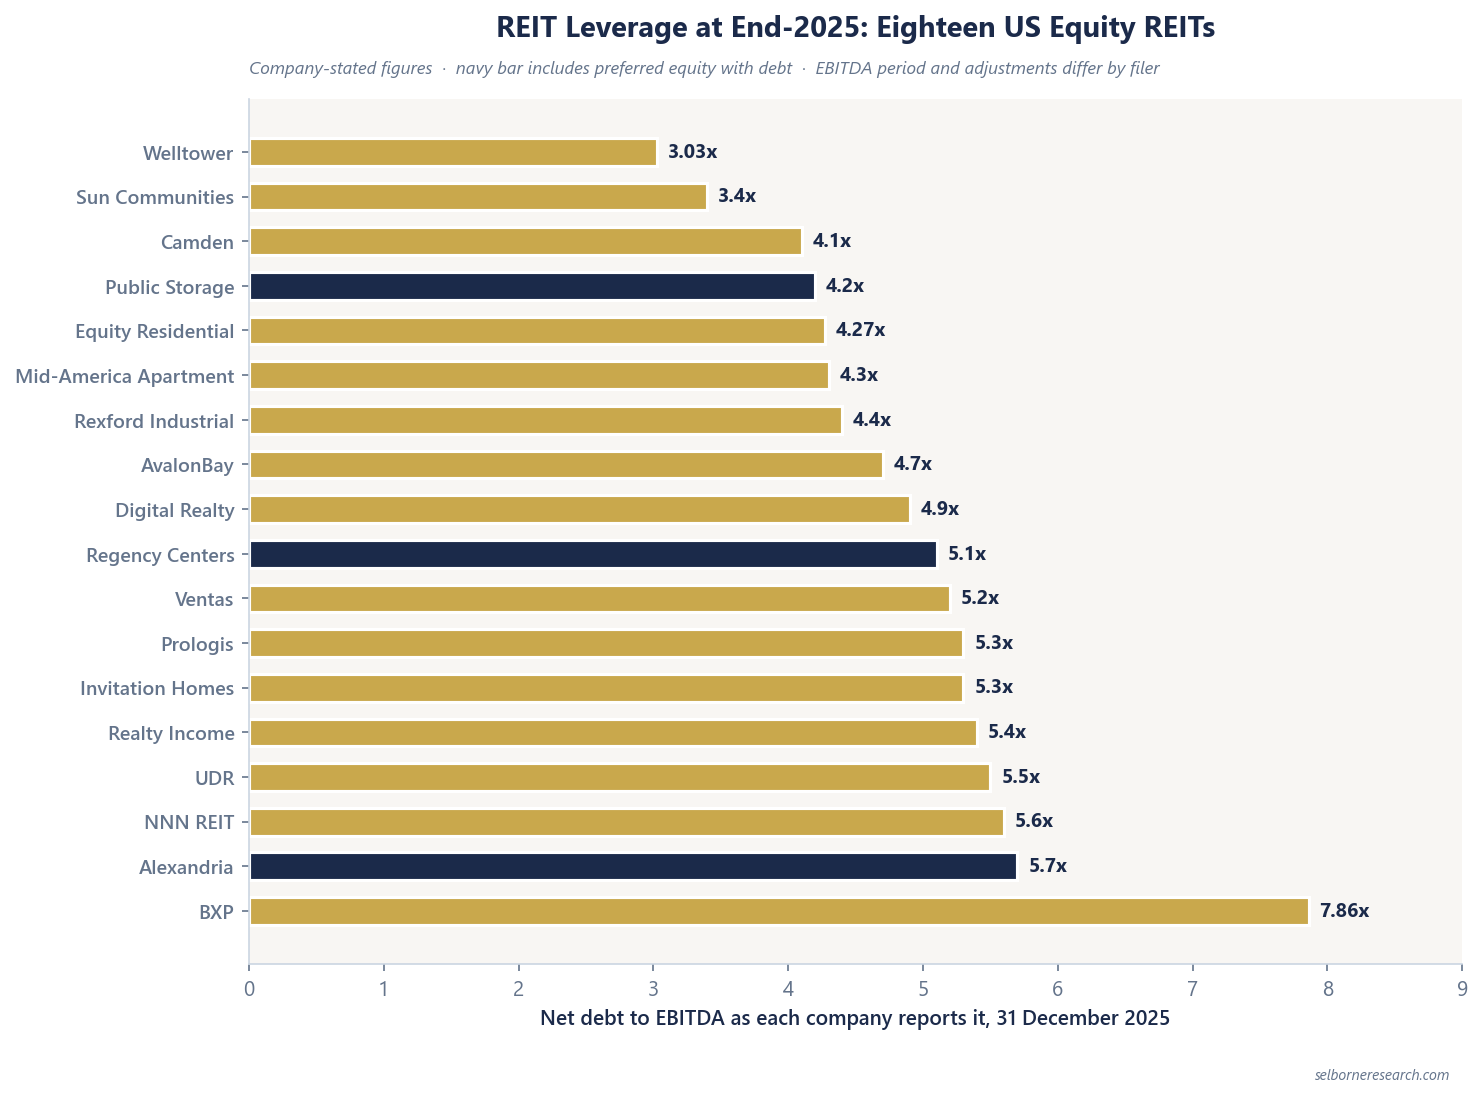
Eight of the eighteen sit between 4.5x and 5.5x, the band the screening checklist calls typical. Seven are below it and three above.
Property Type Explains Part of the Spread
Within one property type the spread stays wide: the five apartment REITs run from 4.1x at Camden to 5.5x at UDR. The two net lease REITs, Realty Income and NNN, sit at 5.4x and 5.6x. Their income comes from long leases with rent fixed in advance, which the checklist says can support more borrowing than income that has to be re-let every few years.
The one office REIT in the set reports the highest figure. BXP’s 7.86x compares with 8.21x at the end of September, on the same basis.
Five Definitions to Check
Most REITs adjust Nareit’s EBITDAre; the table shows each one’s own version.
- The period. Camden, Rexford, AvalonBay, Digital Realty, Prologis, Realty Income, UDR, NNN, Alexandria, BXP and Welltower annualise a quarter’s earnings. Sun Communities, Public Storage, Equity Residential, Mid-America, Regency and Invitation Homes use the trailing twelve months. Ventas reports 5.2x on both bases. A REIT that bought or built during the year looks less levered on an annualised quarter, because an annualised quarter counts the new income for a full year, while trailing twelve months counts it only from the purchase.
- The adjustments. One company can report two answers. Welltower’s supplement shows net debt to EBITDA of 3.99x and net debt to adjusted EBITDA of 3.03x. The headline uses the second.
- Preferred equity. Public Storage, Regency and Alexandria count preferred stock alongside debt. That raises their figures against peers that leave it out.
- Joint ventures. Prologis, BXP, Ventas and Regency report their own share of joint-venture debt and earnings. Digital Realty adds its share of unconsolidated debt and its finance lease obligations.
- Gains. Prologis’s adjusted EBITDA includes development gains. Excluding them, the company reports 5.4x rather than 5.3x.
Cash Moves the Numerator
Net debt deducts cash, so a REIT holding the proceeds of an equity raise or an asset sale reports lower leverage until it spends them. Welltower held $5.2bn of cash and restricted cash at 31 December 2025, which its net debt figure deducts. Read the cash line before reading a low ratio as a permanent feature.
Names Not in the Table
Simon Property, VICI, Federal Realty, Extra Space, Essex and Kimco are not ranked: we found no net debt to EBITDA figure in their fourth-quarter 2025 SEC exhibits. Host Hotels reports a leverage ratio defined by its credit facility, which is a different measure. CubeSmart’s figure appeared only in a later investor presentation.
Adding a REIT to the Table
To add a REIT, check the first four definitions above in its own filing and note any difference beside the figure.
Leverage is one of eight checks the primer runs side by side for six FY2025 names.
- 15 sections, NAV / cap-rate
- 37 pages
- three-segment property NAV DCF + FFO/AFFO bridge
- 2 worked examples
- FFO per share, same-store NOI, occupancy, leverage
- 6-company applied set
The Excel model is the primer's two worked examples live across 13 sheets: change the cap rate, NOI growth or discount rate and the valuation moves.
See what's in the Equity REIT Sector Primer →£25 PDF · £59 with the Excel model · £159 for all three Real Estate industries
Frequently Asked Questions
- What is a typical net debt to EBITDA for a REIT?
- Eighteen large US equity REITs reported between 3.03x and 7.86x at the end of 2025. Eight of them sat between 4.5x and 5.5x. Each figure is the company's own, and the EBITDA behind it differs by period and adjustment, so a gap of a few tenths between two REITs can come from the definition alone.
- Which REIT had the lowest leverage at the end of 2025?
- Welltower, at 3.03x net debt to adjusted EBITDA, followed by Sun Communities at 3.4x and Camden at 4.1x. The bases differ: Welltower annualises its fourth-quarter adjusted EBITDA, while Sun Communities uses trailing twelve-month recurring EBITDA.
- Is net debt to EBITDAre the same at every REIT?
- No. Nareit defines EBITDAre, but most REITs then report an adjusted, core, normalised or recurring version, and they choose the period. Some annualise the fourth quarter, others use the trailing twelve months. Public Storage, Regency Centers and Alexandria include preferred equity with debt. Prologis, BXP, Ventas and Regency report their own share of joint-venture debt and earnings.
Read next
REIT Screening Checklist: 8 Key Metrics
Occupancy, NOI growth, AFFO payout, leverage. Good/caution/red flag thresholds included.
FFO vs AFFO: What's the Difference
Nareit defines FFO; nobody defines AFFO. The adjustments each REIT makes, and how to read them.
Industrial vs Office REITs
Demand drivers, lease structures, and valuation divergence post-2020.
See it applied
These company profiles apply the concepts from this guide to real public companies.
Also in REITs
- What Is FFO? Funds From Operations Explained
- FFO vs AFFO: What's the Difference and Why It Matters
- How to Calculate NAV for a REIT: Step-by-Step
- Commercial Real Estate Cap Rates by Property Type 2026
- REIT Implied Cap Rate: Reading Discount to NAV
- REIT Screening Checklist: 8 Metrics to Track
- Industrial vs Office REITs: Key Differences for Investors
- REIT Net Debt to EBITDA by Company: 2025 Ranked