Chemicals · Specialty Chemicals
Paint and Coatings Business Economics
Architectural, industrial and performance coatings segment margins at SHW and PPG: FY2025 segment spreads and gross margins, store vs OEM mix.
Selborne Research · Specialty Chemicals coverage: 7 guides, 6 company profiles, a primer and Excel model
Educational analysis for professional use. This guide is not investment advice or a recommendation to buy or sell any security, and it is not personalised.
On this page
Coatings Economics Turn on the Sales Channel
Paint and coatings look like one industry but are at least three businesses. Architectural paint sold through stores, industrial coatings sold to manufacturers (original equipment makers, or OEMs) and high-specification performance coatings each have their own margins and pricing rhythm. One consolidated EBITDA margin hides where the pricing power sits; the segment lines Sherwin-Williams and PPG both report show it.
FY2025 Segment Margins
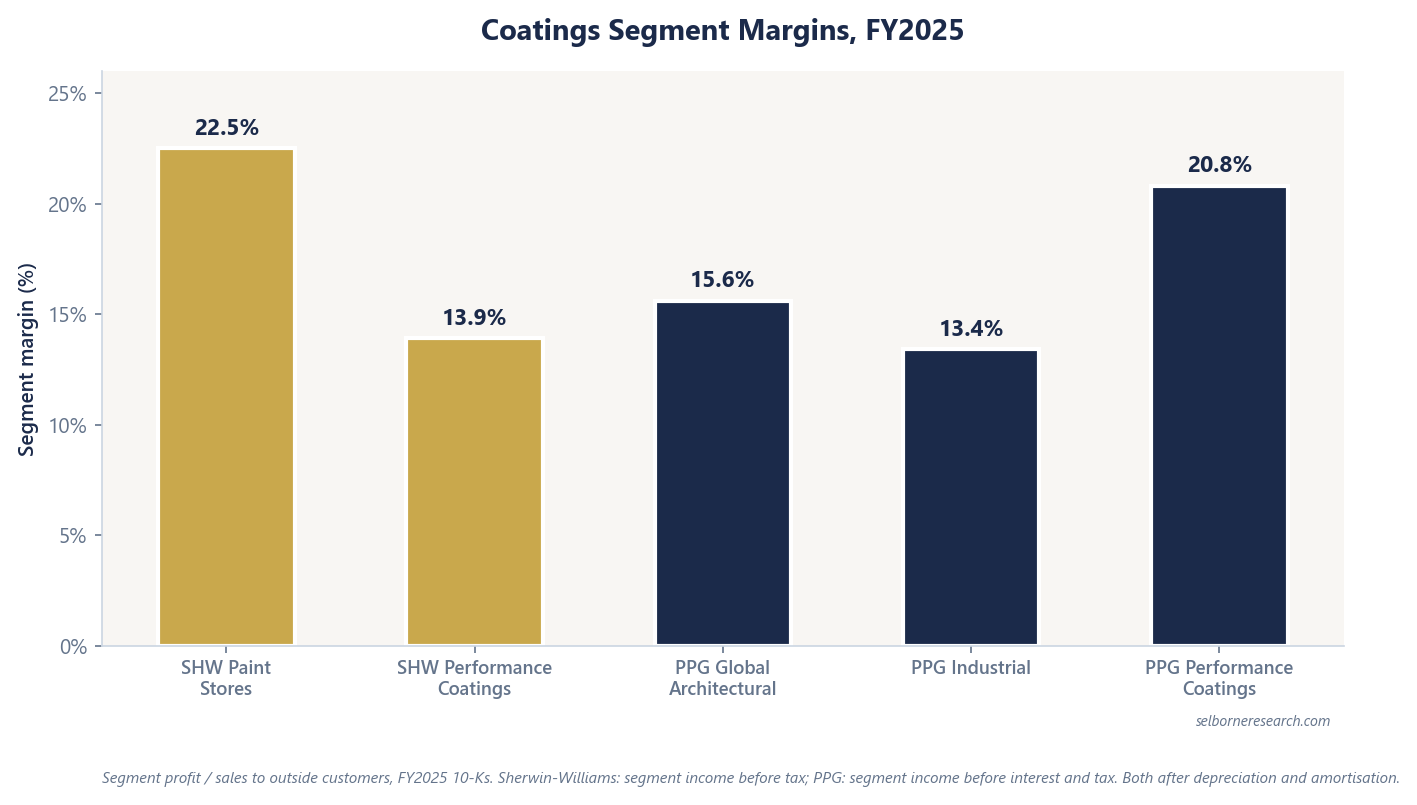
A segment margin here is segment profit divided by sales to outside customers, after depreciation and amortisation, so it is closer to an operating margin than an EBITDA margin. Both companies’ figures are from their FY2025 10-Ks. Most of what Sherwin-Williams’ Consumer Brands makes goes to the company’s own stores and is left out of its sales, so its margin does not compare directly with the others.
| Segment | Company | FY2025 segment margin |
|---|---|---|
| Paint Stores (architectural) | Sherwin-Williams | 22.5% |
| Performance Coatings (industrial) | Sherwin-Williams | 13.9% |
| Consumer Brands | Sherwin-Williams | 16.1% |
| Global Architectural | PPG | 15.6% |
| Industrial | PPG | 13.4% |
| Performance (refinish, aerospace, protective/marine) | PPG | 20.8% |
Architectural and store-led lines earn more than broad industrial lines. PPG’s Performance Coatings come close to the Paint Stores’ margin, because niches such as aerospace and car refinish are hard to switch out of once a coating is specified, much like a paint brand contractors trust.
Consolidated FY2025 Roll-Up
| Metric | Sherwin-Williams | PPG Industries |
|---|---|---|
| Net sales / growth | $23.57B, up 2.1%; Paint Stores up 3.2% | Up 2% before divestitures (volume +1%, price +1%); flat as reported, with divestitures taking off 3% |
| Gross margin | 48.8% (+30 bps) | 41.3% |
| EBITDA margin | 19.6% adjusted | 17.3% adjusted; 19.3% for the segments before corporate costs |
| Net debt / EBITDA | 2.4x | 1.9x |
Sherwin-Williams’ higher gross margin reflects its own store network and architectural mix. PPG’s cost of sales leaves out depreciation, so the like-for-like gap is wider still, as the specialty gross margin guide explains. On EBITDA margin both land between 17% and 20%, close to the 18.01% Damodaran reports for US specialty chemicals as a whole (Jan 2026).
Store Channel vs OEM Mix
A company that owns its stores sets its own shelf prices. Sherwin-Williams’ Paint Stores Group raised prices by a mid-single-digit percentage in FY2025 while its volume fell by a low-single-digit percentage. Industrial coatings sold to manufacturers win or lose specifications contract by contract, with less control of the channel.
PPG shows pricing action too: in April 2026 it announced global price increases of up to 20% on paints, coatings and specialty products. The pricing power guide covers pass-through at both companies. Ecolab, which sells cleaning and water-treatment chemistry with a service attached, reaches a higher EBITDA margin, 23.4% on our derivation, through a different channel again.
From Segment Margins to Value
A business that mixes architectural, performance and industrial lines earns a blend of their margins and growth rates, so a model should carry each segment separately. The lowest margins in the table, PPG’s Industrial and Sherwin-Williams’ Performance Coatings, sit up to 9.1 points below the best, so mix alone can move a group margin by several points.
Specialty Chemicals Sector Primer
A pricing-power compounder and a commodity-linked producer run through the same ten-year DCF, to show when a specialty label has earned its multiple.
- 15 sections, from pass-through and margin stability to a ten-year DCF and the ROIC test behind a premium multiple
- 40 pages
- a pricing-power coatings company and a commodity-linked lithium producer
- 2 worked archetypes
- listed specialty groups on filed organic growth, price contribution and margins
- 6-company screen
The Excel model is the primer's specialty-versus-commodity test live across 12 sheets: a pricing-power coatings archetype valued on a ten-year DCF with organic growth, a stable margin and working capital; a commodity-linked lithium archetype whose price reverts from a trough to a long-run level, valued on the same DCF with a market multiple as a cross-check; a raw-material pass-through test; a derived multiple from ROIC, growth and WACC; ROIC-versus-WACC and leverage screens; and a live sensitivity grid. Change the margin or the terminal growth rate and the value moves; change the pass-through rate and the margin a cost shock takes moves with it.
See what's in the Specialty Chemicals Sector Primer →£25 PDF · £59 with the Excel model · £159 for all three Chemicals industries
Frequently Asked Questions
- Why do architectural coatings earn higher margins than industrial coatings?
- Architectural coatings, the paint used on buildings, sell through distribution the maker controls, with brands that pull customers in and formulations contractors stick with. Industrial coatings sold to manufacturers compete for specifications contract by contract, with less control of the channel. FY2025 segment margins: Sherwin-Williams Paint Stores 22.5% against Performance Coatings 13.9%; PPG Global Architectural 15.6% against Industrial 13.4%.
- What consolidated gross margins do coatings leaders file?
- FY2025 gross margin: Sherwin-Williams 48.8% (+30 bps on the year); PPG 41.3% (40.4% in 2023, 41.6% in 2024). PPG's figure is derived from an income statement whose cost of sales excludes depreciation, so on a like-for-like basis the gap to Sherwin-Williams is somewhat wider than the 7.5 points the two headline figures show.
- Which PPG segment earns the highest margin?
- Performance Coatings (refinish, aerospace, protective and marine), at a 20.8% segment margin in FY2025, above Global Architectural at 15.6% and Industrial at 13.4%. High-specification niches combine specification lock-in with lower cyclicality than broad industrial lines.
- How does Sherwin-Williams' store model affect economics?
- The Paint Stores Group, Sherwin-Williams' chain of company-owned stores, drives the model. In FY2025 its net sales grew 3.2% to $13.61B, on prices up by a mid-single-digit percentage and volume down by a low-single-digit percentage; sales at stores open more than a year rose 1.7%. Group net sales rose 2.1% to $23.57B. Owning the stores keeps the formulation margin and the retail margin in-house: a 48.8% group gross margin and a 19.6% adjusted EBITDA margin.
Read next
Pricing Power and Raw-Material Pass-Through
Scope pass-through convention; filed FY2025 bridges at ECL (+2% price), PPG (+1%) and SHW Q4 PSG; gross margin stability as evidence.
Valuing Specialty Chemicals (Premium P/E)
Why trailing P/E fails; Damodaran EV/EBITDA +56% specialty premium; forward P/E ~18-24x band; why commodity-linked earnings weaken the case for a premium.
Specialty Chemicals Gross Margins by Company
Six filers ranked on FY2025 gross margin with FY2024 beside it: why the order follows what each sells and how, where the bases differ, and when a change reflects price.
See it applied
These company profiles apply the concepts from this guide to real public companies.