Chemicals · Specialty Chemicals
Valuing Specialty Chemicals (Premium P/E)
Why trailing P/E fails in specialty chemicals, the Damodaran EV/EBITDA premium over basic chemicals, and when a commodity-linked segment takes a lower multiple.
Selborne Research · Specialty Chemicals coverage: 7 guides, 6 company profiles, a primer and Excel model
Educational analysis for professional use. This guide is not investment advice or a recommendation to buy or sell any security, and it is not personalised.
On this page
Start With Multiples That Survive Loss-Makers
Specialty chemicals carry a lasting valuation premium over basic chemicals, but only on normalised earnings (earnings at a normal point in the cycle) and only where the economics really are specialty. Trailing P/E gets the comparison wrong: in a downswing many chemical companies lose money and drop out of the average, leaving a figure built from the survivors. Compare on EV/EBITDA, and where you need a P/E, use the aggregate figure.
Damodaran Industry Multiples (Jan 2026)
Damodaran publishes two kinds of figure. A simple average takes each company’s own ratio and averages them; it misleads for three reasons. It counts only the companies that made money, 40.7% of the specialty group and 24.1% of the basic group. It weights each company equally. And a firm with barely positive earnings posts a ratio in the hundreds. An aggregate figure divides the group’s total value by its total earnings, so no small company can dominate.
| Metric | Specialty | Basic / commodity | Premium |
|---|---|---|---|
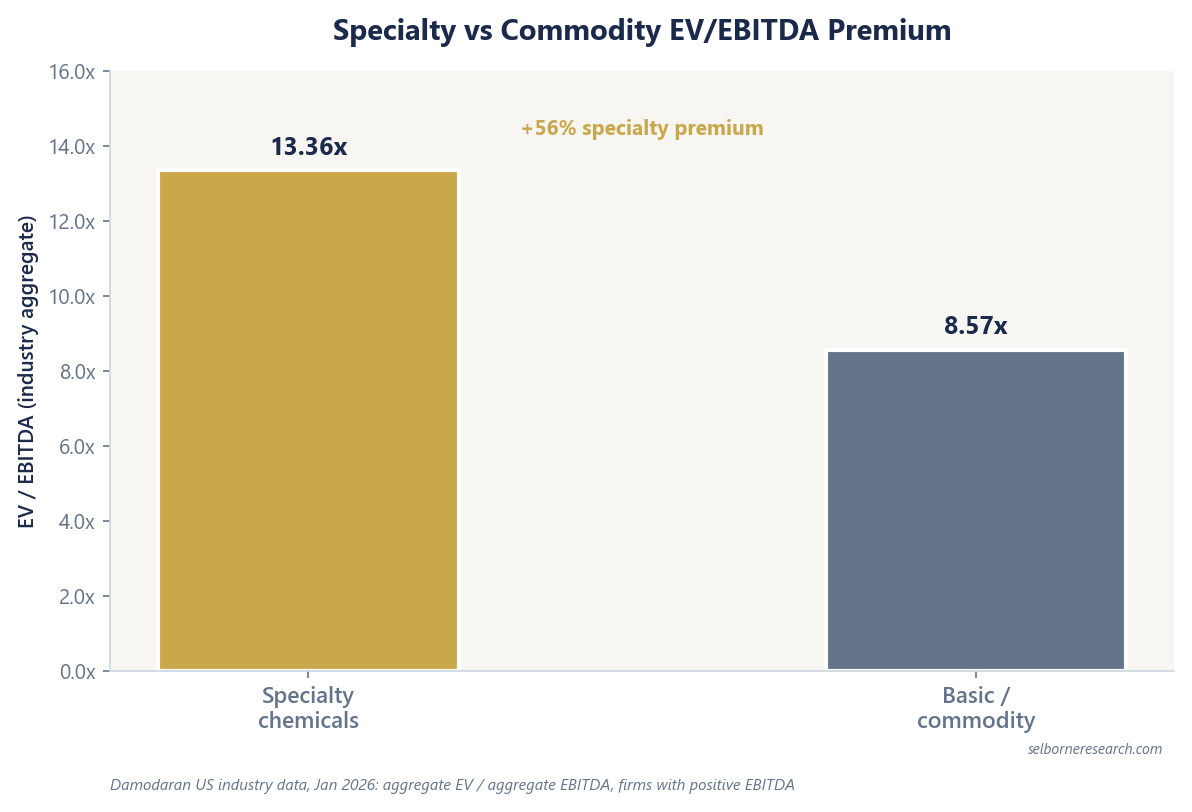
| EV / EBITDA (aggregate, positive-EBITDA firms) | 13.36x | 8.57x | +56% |
| Forward P/E (simple average, profitable firms) | 19.32x | 22.82x | Specialty below basic* |
| Trailing P/E (simple average, profitable firms) | 196.77x | 24.42x | Not usable: loss-makers drop out |
| Trailing P/E (aggregate, profitable firms) | 23.18x | 18.40x | +26% |
| EV / Sales (aggregate) | 2.65x | 0.85x | +212% |
*Basic chemicals’ forward earnings were depressed by the cycle in the Jan 2026 data, which lifts their ratio. It does not mean commodity producers are valued above specialty ones on normal earnings.
Screening Ranges and the Primer’s Figures
| Parameter | Range or figure | Where it comes from |
|---|---|---|
| Specialty forward P/E range | 18-24x | Set around Damodaran’s forward figure above |
| Illustrative specialty forward P/E | 20.0x | The primer’s figure, inside that range |
| Specialty EV/EBITDA premium vs basic | 50-60% | Around Damodaran’s premium above |
| Illustrative specialty EV/EBITDA | 13.5x | Near Damodaran’s specialty figure |
| Illustrative commodity EV/EBITDA | 8.5x | Near Damodaran’s basic figure |
| Commodity through-cycle EV/EBITDA (averaged over a full cycle) | 6-9x | The range the commodity chemicals guides use |
The illustrative figures are the ones the primer and its Excel model use; the ranges are conventions, not measurements. Where a company’s sales bridge shows it taking whatever price the market sets, the commodity figures are the right comparison.
ROIC Spread Links to the Multiple
A multiple above the basic-chemicals level rests on returns above the cost of capital. On Damodaran’s Jan 2026 industry figures specialty chemicals earned 3.70 points above their cost of capital and basic chemicals 2.50 points below it. No large specialty group files an FY2025 ROIC, so for a single company the spread has to be built from its accounts; the ROIC guide shows how.
When a Specialty Label Hides Commodity Pricing
A specialty label on the company does not make every segment specialty. At Albemarle in FY2025 net sales fell 4% to $5,143M while volume rose 7%, because lithium prices fell, and gross margin was 13.0% after 1.2% in FY2024. Its bromine business, by contrast, sells on performance. The price per kilogram that drives the lithium side is explained in the lithium carbonate vs hydroxide guide.
Value a segment like that on its cash flows at a stated long-run commodity price, and use a published multiple only as a cross-check. A basic-chemicals multiple is measured on trailing earnings that may be depressed. Apply it to earnings already restored to a long-run price and you count the recovery twice.
Worked Comparison: Formulation vs Commodity-Linked
Two fictional companies from the primer’s Excel model, each valued on a ten-year DCF at its own cost of capital:
| Pricing-power coatings company | Commodity-linked lithium producer | |
|---|---|---|
| Revenue | $4,000M | $1,553M (90% of 150 thousand tonnes a year of capacity, in lithium carbonate equivalent or LCE, at $11.50/kg) |
| EBITDA margin | 18.0% | 21.7% at the long-run price |
| EBITDA | $720M | $338M at the long-run price |
| ROIC vs cost of capital | 16.1% vs 7.66% | 5.4% vs 8.94% |
| DCF enterprise value | $7.9B | $1.1B |
| DCF value ÷ EBITDA | 11.0x | 3.3x |
Each cost of capital is built in the model from its own rate assumptions for that type of business, so neither matches Damodaran’s industry figures exactly. The lithium producer earns the higher margin once its price has recovered, yet its DCF value is a far smaller multiple of that EBITDA. Two things drive the gap. It starts at a low-point price below its cash cost and loses money in the first year. And even at the long-run price its return on capital sits below its cost of capital, so every dollar it reinvests to grow destroys value.
Evidence Before a Multiple
Check the filings before attaching any multiple: a positive price line in the sales bridge, a gross margin that holds through raw-material swings, and returns above the cost of capital.
Specialty Chemicals Sector Primer
A pricing-power compounder and a commodity-linked producer run through the same ten-year DCF, to show when a specialty label has earned its multiple.
- 15 sections, from pass-through and margin stability to a ten-year DCF and the ROIC test behind a premium multiple
- 40 pages
- a pricing-power coatings company and a commodity-linked lithium producer
- 2 worked archetypes
- listed specialty groups on filed organic growth, price contribution and margins
- 6-company screen
The Excel model is the primer's specialty-versus-commodity test live across 12 sheets: a pricing-power coatings archetype valued on a ten-year DCF with organic growth, a stable margin and working capital; a commodity-linked lithium archetype whose price reverts from a trough to a long-run level, valued on the same DCF with a market multiple as a cross-check; a raw-material pass-through test; a derived multiple from ROIC, growth and WACC; ROIC-versus-WACC and leverage screens; and a live sensitivity grid. Change the margin or the terminal growth rate and the value moves; change the pass-through rate and the margin a cost shock takes moves with it.
See what's in the Specialty Chemicals Sector Primer →£25 PDF · £59 with the Excel model · £159 for all three Chemicals industries
Frequently Asked Questions
- Why is trailing P/E unreliable for specialty chemicals?
- Damodaran's Jan 2026 trailing P/E for specialty chemicals is 196.77x, against 24.42x for basic chemicals. It is a simple average of each profitable company's P/E: the 59.3% of specialty firms (75.9% of basic) that lost money drop out, every company counts equally however small, and a firm with barely positive earnings posts a huge ratio. Damodaran's aggregate figure for profitable firms, total market value over total earnings, is 23.18x specialty against 18.40x basic (+26%). EV/EBITDA is the cleaner comparison.
- What EV/EBITDA premium does specialty chemicals trade at?
- On Damodaran's Jan 2026 US data, aggregate EV/EBITDA for firms with positive EBITDA was 13.36x in specialty chemicals against 8.57x in basic chemicals, a 56% premium. The primer's Excel model uses 13.5x and 8.5x as its market cross-checks.
- What forward P/E range applies to true specialty companies?
- A conventional range is 18-24x forward earnings. Damodaran's Jan 2026 forward P/E, a simple average across profitable firms, was 19.32x for specialty and 22.82x for basic chemicals: basic chemicals' forward earnings were depressed by the cycle, which pushes their ratio up, so the forward comparison says little on its own.
- How is a commodity-linked segment inside a specialty company valued?
- On its own economics. When a segment's selling price is set by a commodity market, as lithium's is, its earnings swing with that price, so a model values it on cash flows at a stated long-run price. A published basic-chemicals multiple then serves only as a cross-check, because it is measured on trailing earnings that may themselves be depressed.
Read next
ROIC in Specialty Chemicals
Damodaran sector return on capital 10.95% vs WACC 7.25% (+3.70 pp spread); why FY2025 issuer ROIC is absent; how to read the spread.
Specialty vs Commodity Chemicals
Performance versus molecule-cost economics; S&P risk scores specialty '2' vs commodity '4'; filed margin spreads across SHW, ECL, PPG, DD, IFF and ALB.
Lithium Carbonate vs Lithium Hydroxide
Two lithium products with different feed routes and cathode uses, reported in one unit: how to convert any lithium tonnage to LCE, and why a realised price differs from an index.
See it applied
These company profiles apply the concepts from this guide to real public companies.