Chemicals · Specialty Chemicals
Specialty Chemicals Gross Margins by Company
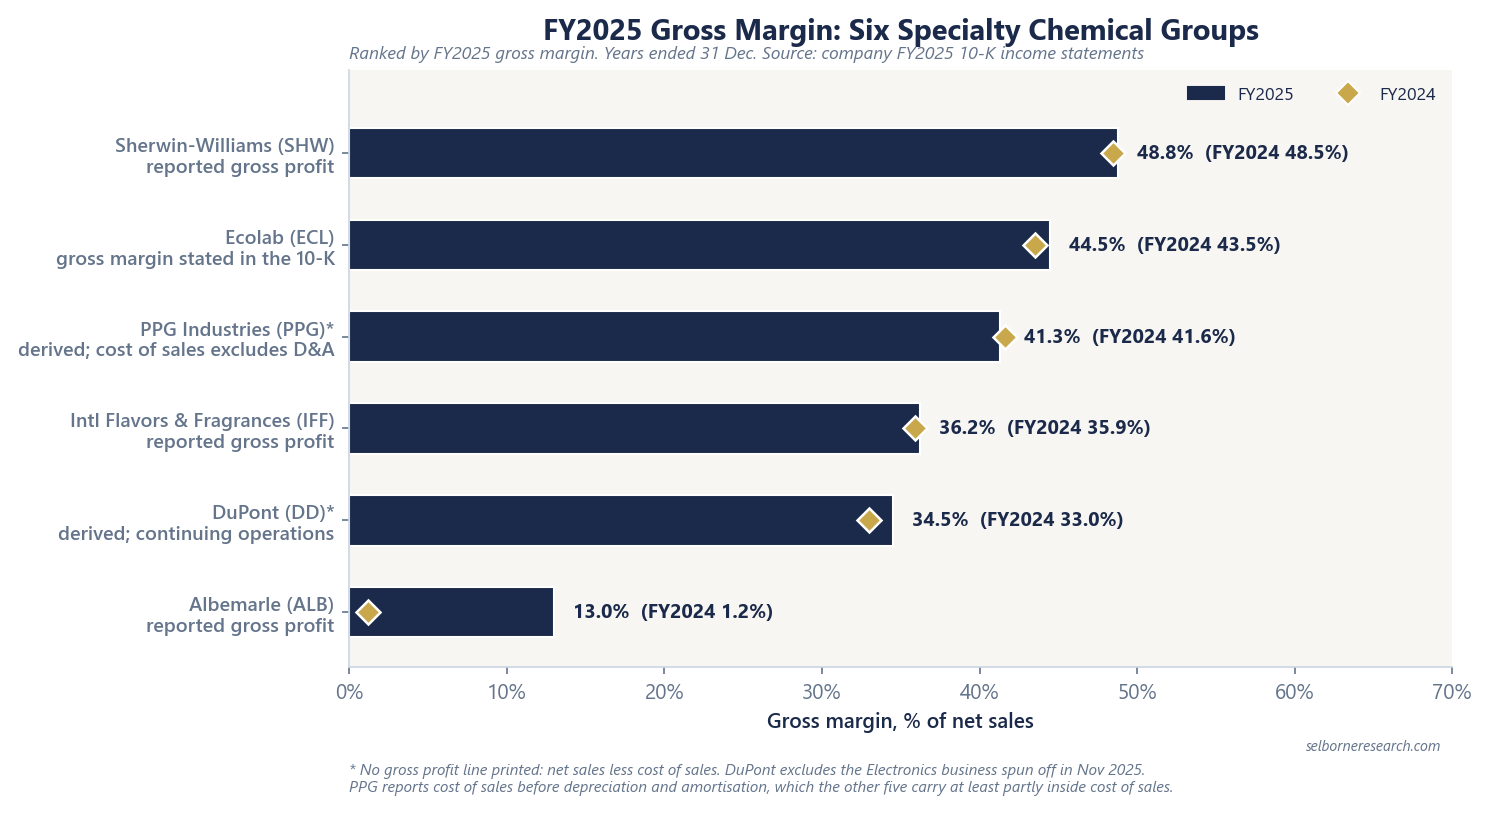
Six specialty chemical groups earned FY2025 gross margins from 13.0% to 48.8%. Why the order follows what each sells, where bases differ, what a change shows.
Selborne Research · Specialty Chemicals coverage: 7 guides, 6 company profiles, a primer and Excel model
Educational analysis for professional use. This guide is not investment advice or a recommendation to buy or sell any security, and it is not personalised.
On this page
Gross Margin Ranks Business Models
In specialty chemicals, gross margin ranks business models. Six listed groups reported FY2025 gross margins from 13.0% to 48.8%, and the order follows what each company sells and how it reaches the customer. Paint made and sold in the company’s own stores sits at the top, then chemistry sold with a service, then ingredients and materials sold to other manufacturers, and lithium, priced off a commodity market, sits at the bottom. The table says little about which management team is better.
Gross margin is net sales less cost of sales, divided by net sales. Cost of sales covers raw materials, plant labour, energy and, at most companies, the depreciation of the plants. It leaves out selling, administration and research, which is one reason the six fall in a different order on EBITDA margin. What separates a specialty business from a commodity one is covered in the specialty vs commodity guide.
FY2025 Gross Margins, Six Companies
| Company | FY2025 gross margin | FY2024 | Change | EBITDA margin, company basis | How the gross margin is shown |
|---|---|---|---|---|---|
| Sherwin-Williams | 48.8% | 48.5% | +30 bps | 19.6% adjusted EBITDA | Gross profit line |
| Ecolab | 44.5% | 43.5% | +100 bps | 23.4% EBITDA, unadjusted | Stated in the 10-K |
| PPG Industries | 41.3% | 41.6% | −30 bps | 17.3% adjusted EBITDA | Derived; cost of sales excludes D&A |
| International Flavors & Fragrances | 36.2% | 35.9% | +30 bps | 19.2% adjusted operating EBITDA | Gross profit line |
| DuPont | 34.5% | 33.0% | +150 bps | 23.8% operating EBITDA | Derived; continuing operations |
| Albemarle | 13.0% | 1.2% | +1,180 bps | 21% adjusted EBITDA | Gross profit line |
Years to 31 December 2025 and 2024, from each company’s FY2025 10-K. “Derived” means net sales less cost of sales, because the income statement prints no gross profit line. Changes are on the rounded figures. Each EBITDA margin follows the company’s own definition; Ecolab’s is net income plus tax, interest, depreciation and amortisation, with no adjustments, divided by net sales.
Same Line, Different Definitions
Two of the six print no gross profit line, so their figures are built from the income statement. DuPont’s figure covers continuing operations only, after it spun off its Electronics business as Qnity in November 2025, and its FY2024 figure is shown on the same basis.
PPG’s figure needs a bigger caveat. The other five leave the depreciation of their plants inside cost of sales. PPG shows FY2025 depreciation of $403M, 2.5% of net sales, on a line of its own, and does not say how much of it belongs to its plants. So its margin is flattered against the others by up to that much, and like-for-like the gap to Sherwin-Williams lies between 7.5 and 10.0 points.
The EBITDA column is less comparable still. Ecolab’s figure carries no adjustments, while the other five remove items each company defines for itself, and Albemarle’s includes profit from a lithium mining joint venture (explained below). Keep the label on every row.
Channel and Product Explain the Order
Sherwin-Williams sold 57.7% of its FY2025 net sales through its Paint Stores Group: 4,853 company-operated paint stores in the US, Canada and the Caribbean, stocked mostly with paint from its own plants. Making the paint and selling it over its own counter puts the manufacturer’s margin and the retailer’s in one gross profit line; the cost of the stores shows up further down. Selling, general and administrative costs took 32.6% of net sales, and the stores’ own SG&A rose $183.7M in FY2025 on staff costs and new openings. The drop from gross margin to adjusted EBITDA margin, about 29 points, is the widest of the six.
Ecolab sells water treatment, hygiene and infection-prevention programmes: chemistry delivered with service. Service and lease sales were $3,462.7M, 21.5% of FY2025 net sales, reported alongside product and equipment sales. Its 10-K puts the one-point rise in FY2025 gross margin down to value pricing, Ecolab’s term for its price increases.
International Flavors & Fragrances and DuPont sit in the mid-30s. Both sell ingredients and materials that other companies build into their own products: flavours, fragrances and food and health ingredients at IFF; water, healthcare and industrial materials at DuPont. Both sell mainly to other manufacturers, so neither captures a retail margin.
Albemarle sits far below the rest. Its Energy Storage business sells battery-grade lithium carbonate and hydroxide, in part under contracts that reference market price indices, so its selling price is set outside the company.
Why 1,180 Basis Points and 30 Mean Different Things
Albemarle’s gross margin rose in a year when its revenue fell 4%. Its 10-K gives three reasons: lower average input costs, which followed lower lithium market prices; higher volume; and currency. Part of its lithium feed is spodumene, a lithium-bearing mineral concentrate, bought from Windfield, a 49%-owned joint venture that owns the Greenbushes mine. Spodumene prices fell with the lithium market, and purchases from unconsolidated affiliates in cost of goods sold fell from $1.7B in FY2024 to $534M in FY2025. When the selling price and the main input both track one commodity, at different speeds, a thin gross margin can move ten points in a year.
The same price fall cut Windfield’s profit, which reaches Albemarle as equity income, below gross profit. Equity income from all Albemarle’s unconsolidated investments, most of it Windfield, was $243.7M after tax in FY2025 against $715.4M in FY2024, down about two-thirds. For a business built like this, read gross profit and equity income together.
Sherwin-Williams’ 30 basis points had a different source. Its 10-K credits the stores’ higher gross profit to favourable selling prices and moderating raw-material costs, partly offset by lower volume. The company sets its own shelf prices, so a raw-material cost that eases while those prices hold shows up as a small gain.
For a coatings or services business, gross margin usually moves less than 100 bps a year. A move above 200 bps is a signal to look for commodity prices or inventory effects; it tells you where to look, and is not a test a company passes or fails.
Read the Change Beside the Price and Volume Split
A rising gross margin looks like pricing power. It proves it only when the price line of the sales bridge points the same way. Three of the six file a full-year split of organic growth into price and volume.
| Company, FY2025 | Organic sales growth | Price | Volume | Gross margin change |
|---|---|---|---|---|
| Ecolab | +3% | +2% | +1% | +100 bps |
| PPG Industries | +2% | +1% | +1% | −30 bps |
| DuPont | +2% | −1% | +3% | +150 bps |
Organic growth on each company’s own definition, excluding currency, acquisitions and disposals.
Ecolab’s price and margin agree, and its filing ties the margin gain to value pricing. PPG raised prices and still lost margin, so costs or mix moved against it by more than the price gained. DuPont cut prices and still gained margin. That gain came from volume, mix or cost, and the gross margin alone cannot say which. Sherwin-Williams (outside its Paint Stores Group), IFF and Albemarle file no full-year price and volume split, so read their changes from the management discussion instead. The pass-through guide works through the bridges one by one.
What the Consolidated Line Hides
A group gross margin blends every business the company owns. Sherwin-Williams’ stores and its Performance Coatings Group, which sells industrial coatings, earn different segment margins, and PPG’s three segments were 7.4 points apart in FY2025. Segment margins in these filings are measured on segment income, not gross profit, so they do not drop into the table above. The coatings economics guide sets them side by side.
Portfolio changes move the group figure too. Disposals took 3% off PPG’s FY2025 net sales, and a change of that size can shift the group margin with no change in any business that remains. Before reading a move in a company’s gross margin as a move in its business, check the segment note and what was bought or sold during the year.
Specialty Chemicals Sector Primer
A gross margin matters once it reaches cash. The primer carries a stable margin through a ten-year coatings DCF and tests how much of a cost shock sticks.
- 15 sections, from pass-through and margin stability to a ten-year DCF and the ROIC test behind a premium multiple
- 40 pages
- a pricing-power coatings company and a commodity-linked lithium producer
- 2 worked archetypes
- listed specialty groups on filed organic growth, price contribution and margins
- 6-company screen
The Excel model is the primer's specialty-versus-commodity test live across 12 sheets: a pricing-power coatings archetype valued on a ten-year DCF with organic growth, a stable margin and working capital; a commodity-linked lithium archetype whose price reverts from a trough to a long-run level, valued on the same DCF with a market multiple as a cross-check; a raw-material pass-through test; a derived multiple from ROIC, growth and WACC; ROIC-versus-WACC and leverage screens; and a live sensitivity grid. Change the margin or the terminal growth rate and the value moves; change the pass-through rate and the margin a cost shock takes moves with it.
See what's in the Specialty Chemicals Sector Primer →£25 PDF · £59 with the Excel model · £159 for all three Chemicals industries
Frequently Asked Questions
- What gross margin do specialty chemical companies earn?
- Among six large listed specialty chemical groups, FY2025 gross margins ran from 13.0% at Albemarle, whose Energy Storage business sells lithium at market-linked prices, to 48.8% at Sherwin-Williams, which makes paint and sells it mainly through its own stores. The other four sat between 34.5% (DuPont) and 44.5% (Ecolab). PPG's and DuPont's figures are derived from the income statement, and PPG's cost of sales excludes depreciation, so the six are not all on one basis.
- Why is Sherwin-Williams' gross margin so high?
- Because it makes the paint and sells it over its own counter. Its Paint Stores Group, 4,853 company-operated stores at the end of 2025, took 57.7% of FY2025 net sales, and most of what those stores sell comes from its own plants. The manufacturer's margin and the retailer's margin land in one gross profit line. The cost of running the stores sits below it: selling, general and administrative costs were 32.6% of net sales, which is why a 48.8% gross margin became a 19.6% adjusted EBITDA margin.
- Why is Albemarle's EBITDA margin higher than its gross margin?
- Because part of its profit arrives below the gross profit line. Albemarle owns 49% of Windfield, the joint venture that owns the Greenbushes lithium mine, and books its share of Windfield's profit as equity income. Equity income from all its unconsolidated investments, most of it Windfield, was $243.7M after tax in FY2025. Adjusted EBITDA includes that income on a pre-tax basis and adds back depreciation and amortisation. Gross margin is struck after the depreciation in cost of goods sold and before the equity income, so 13.0% gross became 21% adjusted EBITDA.
- Does a rising gross margin prove pricing power?
- Only when the price line of the sales bridge points the same way. In FY2025 Ecolab's gross margin rose 100 bps with price contributing +2% to organic growth, and its 10-K attributes the gain to value pricing. DuPont's rose 150 bps while its prices fell 1%, so that gain came from volume, mix or cost. PPG raised prices 1% and its gross margin still slipped 30 bps.
Read next
Pricing Power and Raw-Material Pass-Through
Scope pass-through convention; filed FY2025 bridges at ECL (+2% price), PPG (+1%) and SHW Q4 PSG; gross margin stability as evidence.
Paint and Coatings Business Economics
Architectural vs industrial segment margins: SHW PSG 22.5% vs PCG 13.9%; PPG Performance 20.8% vs Industrial 13.4%; consolidated gross margins SHW 48.8% vs PPG 41.3%.
Specialty vs Commodity Chemicals
Performance versus molecule-cost economics; S&P risk scores specialty '2' vs commodity '4'; filed margin spreads across SHW, ECL, PPG, DD, IFF and ALB.
Lithium Carbonate vs Lithium Hydroxide
Two lithium products with different feed routes and cathode uses, reported in one unit: how to convert any lithium tonnage to LCE, and why a realised price differs from an index.
See it applied
These company profiles apply the concepts from this guide to real public companies.