Technology · Semiconductors
Capex to Revenue by Chip Company
Ranked capex as a share of revenue for six chip filers. Business model sets the order from foundry and IDM down to fabless and equipment.
Selborne Research · Semiconductors coverage: 9 guides, 6 company profiles, a primer and Excel model
Educational analysis. This guide is not investment advice or a recommendation to buy or sell any security, and it is not personalised.
On this page
Business Model Sets the Capex Order
Capex as a share of revenue ranks who owns the plant. A foundry and a leading-edge integrated maker sit at the top, followed by an analog maker mid-build and a memory maker. An equipment maker and a fabless designer sit at the bottom because their heavy assets are either tools sold to others or wafers bought from a foundry.
The ladder below uses each filer’s own fiscal year. For Intel, the ranked figure is cash-flow additions to property, plant and equipment; gross capex and partner funding sit in the notes column so the funding split is visible.
Capex to Revenue, Ranked
| Rank | Company | Fiscal year | Capex % of revenue | Notes |
|---|---|---|---|---|
| 1 | TSMC | FY2025 | 33.4% | Foundry plant programme |
| 2 | Intel | FY2025 | 27.7% | Cash-flow additions; gross capex 33.4% before $6.5B partner and incentive funding |
| 3 | Texas Instruments | FY2025 | 25.7% | $4.6B in a six-year 300mm build |
| 4 | Micron | FY2026 | 23.1% | Memory capacity |
| 5 | ASML | FY2025 | 4.8% | Equipment maker; customers carry fab capex |
| 6 | Nvidia | FY2026 | 2.8% | Fabless designer |
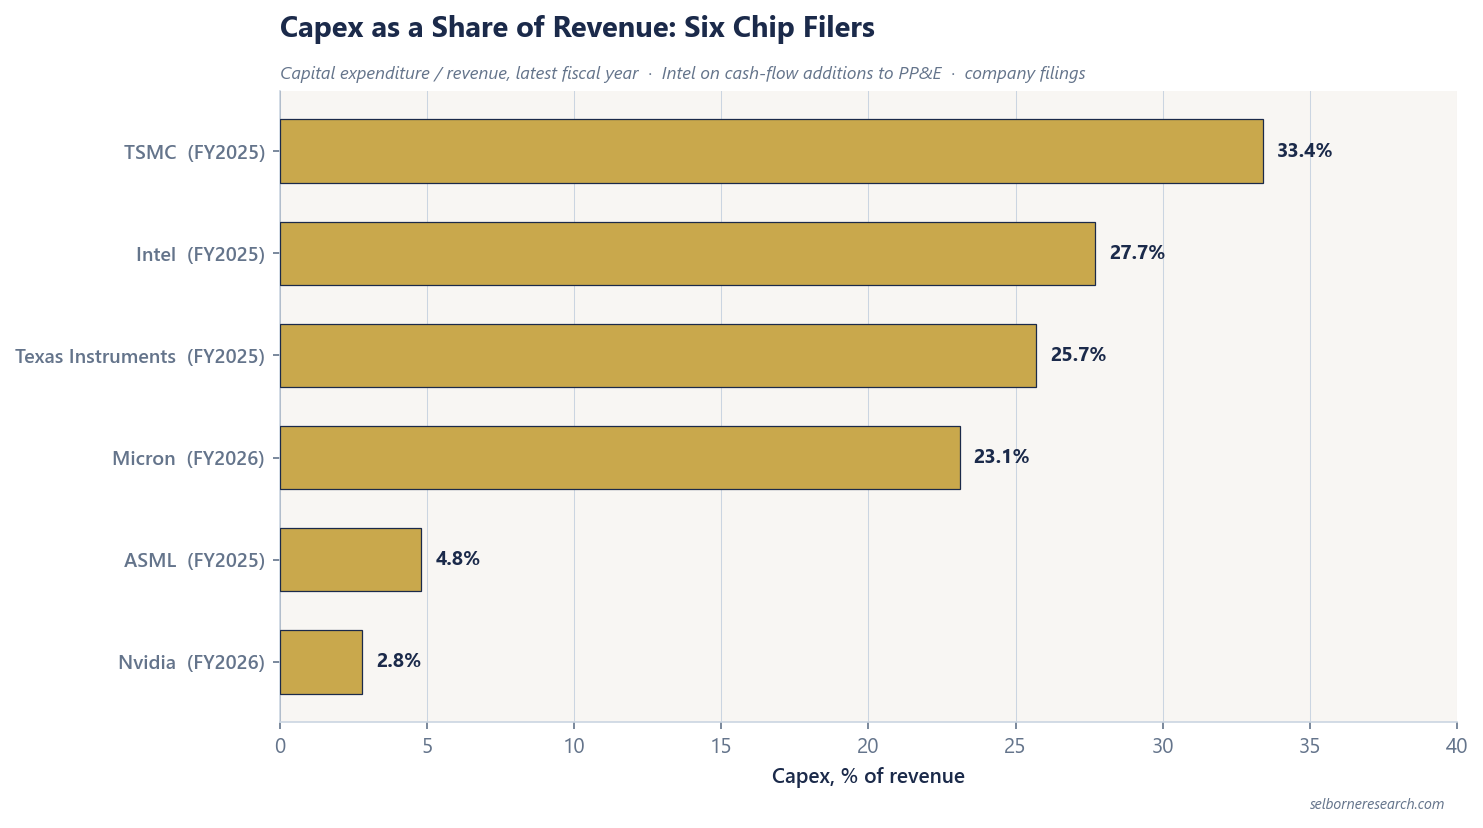
TSMC and Intel look close once Intel is shown on a gross basis (both 33.4%). On cash-flow additions alone Intel ranks second. Nvidia at 2.8% is not “efficient capex”; it is a different asset map. Micron at 23.1% is the memory plant load for FY2026.
How to Read Adjacent Rungs
Texas Instruments at 25.7% is elevated by a six-year 300mm fab build. Capex was $0.5B in FY2016 and $5.1B in FY2023 before the $4.6B FY2025 print. A single-year ladder without that history can overstate the steady-state ratio.
ASML at 4.8% looks light next to chipmakers because its customers own the cleanrooms. Its capital story shows up in backlog and customer spend.
Same Ratio, Different Questions
Use the ladder to ask which business model you are modelling. Capital intensity in semiconductors turns the ratio into a return requirement and the two-year lag to capacity. Fabless versus foundry versus IDM explains why the order above is structural. Utilisation and gross margin shows what happens when the plant those capex dollars bought runs half-empty.
Capex to revenue is a first input to through-cycle free cash flow; the primer sets capital intensity by business model in the multi-period chip valuation.
- 17 sections, from the business models and the industry cycle to capital intensity, memory, inventory, equipment orders, stock pay and a reverse DCF
- 44 pages
- a chip designer, a foundry, a memory maker and an equipment maker, all fictional
- 4 worked valuations
- listed chip companies on filed margins, capital intensity, inventory days and stock pay, each with its fiscal year
- 6-company screen
The Excel model is the primer's through-cycle DCF live across 13 sheets: a chip designer, a foundry, a memory maker and an equipment maker, all fictional, plus a column for a company of your own in any of five business-model modes. Each mode turns the industry cycle into revenue its own way: units and selling prices, capacity times utilisation times revenue per wafer, bit demand against bit supply, orders and installed-base services, or wafer starts for a materials supplier. Depreciation sits in cost of goods for fab owners, capacity arrives two years after the capex that pays for it, and the terminal value is struck on mid-cycle cash flow. A reverse DCF reads the margin and the growth a price requires, and the sensitivity grids re-run the model in every cell.
See what's in the Semiconductors Sector Primer →£25 PDF · £59 with the Excel model · £159 for all three Technology industries
Frequently Asked Questions
- Which chip company has the highest capex to revenue?
- In this six-filer set on the ranking basis used here, TSMC is highest at 33.4% of FY2025 revenue. Intel cash-flow additions to property, plant and equipment were 27.7% of FY2025 revenue; gross capex including amounts met by partners and incentives was 33.4%.
- Why is Nvidia capex so low?
- Nvidia is fabless: it designs chips and contracts manufacturing. FY2026 capex was 2.8% of revenue. The heavy plant spend sits at the foundry, not on the designer balance sheet.
- Should Intel be ranked on cash-flow or gross capex?
- State both. Cash-flow additions were 27.7% of FY2025 revenue; gross capex was $17.7B, or 33.4%, of which $6.5B was met by partners and government incentives. Ranking only one figure hides the funding split.
- Where does memory sit on the ladder?
- Micron FY2026 capex was 23.1% of revenue, below Texas Instruments at 25.7% (FY2025) and above ASML at 4.8% (FY2025). Memory plants are capital-heavy, but this year the ratio sits under the leading-edge foundry and IDM names in the set.
Read next
Capital Intensity in Semiconductors
Capex to revenue sets what a chipmaker must earn. Spend reaches capacity about two years later; TSMC and Intel are the worked cases.
Fabless vs Foundry vs IDM vs OSAT
Four chip business models defined by who owns which assets, with margin and capex profiles from Nvidia, TSMC and Intel filings.
Fab Utilisation and Gross Margin
Depreciation is fixed, so a few points of utilisation move gross margin sharply. TSMC billing utilisation and Intel margin decline as worked cases.
See it applied
These company profiles apply the concepts from this guide to real public companies.