Technology · Semiconductors
Days of Inventory by Chip Company
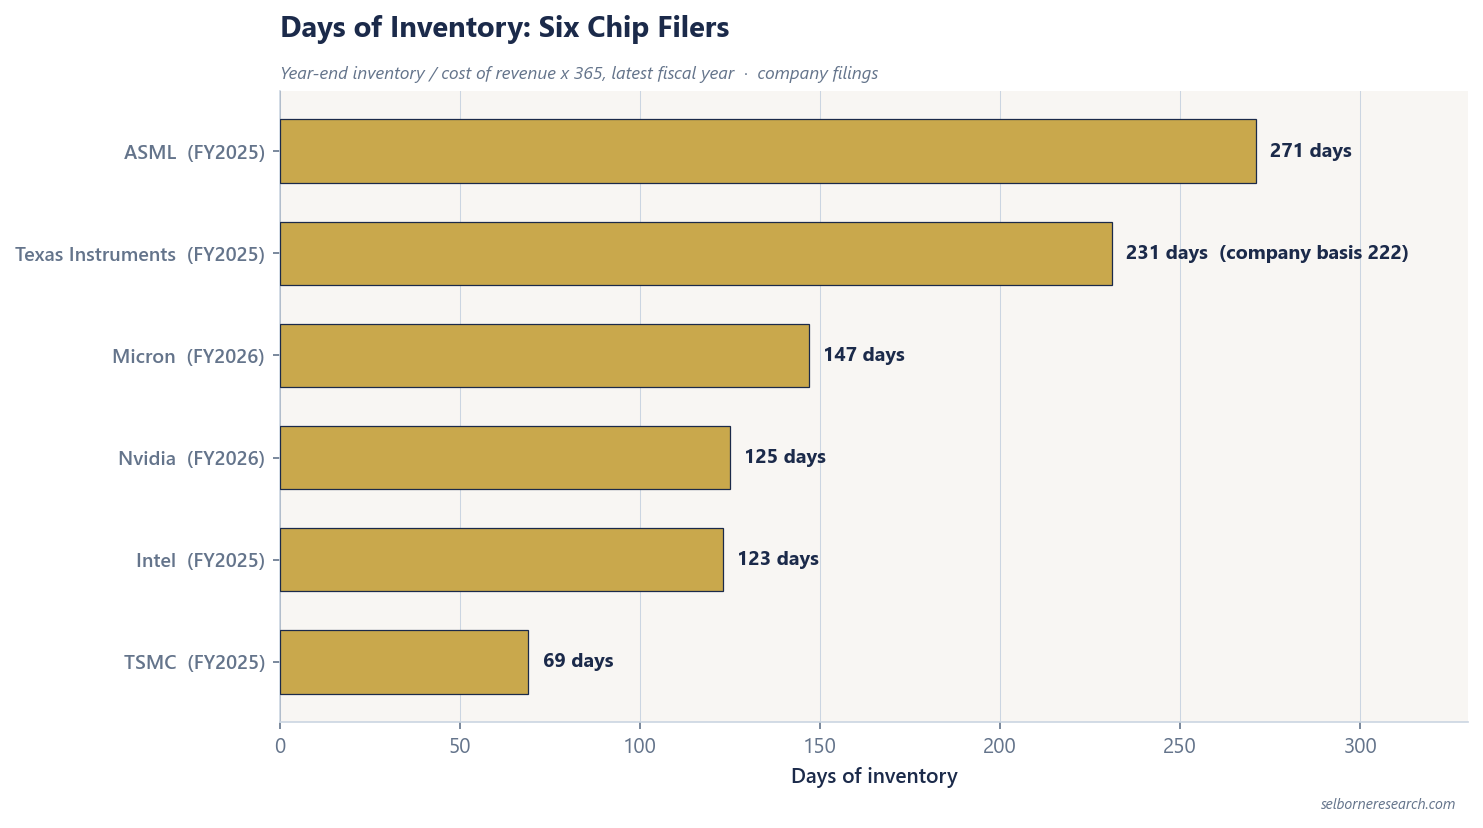
Ranked days of inventory for six chip filers from year-end balances, with DSO, DPO and fiscal year. Business model explains most of the spread.
Selborne Research · Semiconductors coverage: 9 guides, 6 company profiles, a primer and Excel model
Educational analysis. This guide is not investment advice or a recommendation to buy or sell any security, and it is not personalised.
On this page
Business Model Explains Most of the Spread
Days of inventory on year-end balances run from under 70 at a pure foundry to over 270 at an equipment maker. That spread is not one year’s noise. A foundry turns wafers for customers and sits at the bottom. An analog integrated maker that builds stock ahead of demand by choice sits in between.
The table uses year-end inventory divided by cost of revenue, times 365. Where a filer states its own days on another basis, that figure sits beside the year-end calculation.
Days of Inventory, Ranked
| Rank | Company | Fiscal year | Days of inventory | DSO | DPO | CCC (days) |
|---|---|---|---|---|---|---|
| 1 | ASML | FY2025 | 271 | 34 | 83 | 221 |
| 2 | Texas Instruments | FY2025 | 231 | 41 | 36 | 235 |
| 3 | Micron | FY2026 | 147 | 87 | 50 | 185 |
| 4 | Nvidia | FY2026 | 125 | 65 | 57 | 133 |
| 5 | Intel | FY2025 | 123 | 27 | 105 | 45 |
| 6 | TSMC | FY2025 | 69 | 27 | 20 | 76 |
Texas Instruments also states 222 days on its own basis against the 231 computed from year-end balances. Both are correct on the basis stated.
Cash conversion cycle here is days of inventory plus days sales outstanding minus days payables outstanding, from the same year-end balances. Hardware names sometimes run negative cycles when payables dominate; that pattern is covered in negative cash conversion cycles in hardware. In this chip set every name is positive on the figures above.
Why the Top and Bottom Differ
ASML at 271 days is the equipment maker in the set. Reading 271 days as “too much stock” without the equipment context misreads the model.
Texas Instruments at 231 days (222 on the company-stated basis) is high by design: its 10-K describes building broad-based products ahead of demand to keep customer service high.
TSMC at 69 days is the foundry extreme: it builds wafers for its customers. Nvidia at 125 days and Intel at 123 days land close on inventory days but differ widely on capital intensity and margin.
Micron at 147 days sits in the middle of the ladder; the sharper memory swing shows up more in gross margin across the cycle and in bit pricing than in a single year-end days print.
How to Use the Ladder
Compare a name to its own history and to peers in the same business model before calling days high or low. Rising days ahead of falling revenue is the inventory-cycle warning; a steadily high level at an equipment maker, or at an analog maker that builds ahead of demand by choice, may simply be how that business runs.
Recompute from the filing when the company states a different basis. The Texas Instruments 231 versus 222 gap is the template: show and label both, and do not average them into a third number the filing never used.
Inventory days feed working-capital investment in a chip model; the primer sets days by business model and lets them move with the cycle.
- 17 sections, from the business models and the industry cycle to capital intensity, memory, inventory, equipment orders, stock pay and a reverse DCF
- 44 pages
- a chip designer, a foundry, a memory maker and an equipment maker, all fictional
- 4 worked valuations
- listed chip companies on filed margins, capital intensity, inventory days and stock pay, each with its fiscal year
- 6-company screen
The Excel model is the primer's through-cycle DCF live across 13 sheets: a chip designer, a foundry, a memory maker and an equipment maker, all fictional, plus a column for a company of your own in any of five business-model modes. Each mode turns the industry cycle into revenue its own way: units and selling prices, capacity times utilisation times revenue per wafer, bit demand against bit supply, orders and installed-base services, or wafer starts for a materials supplier. Depreciation sits in cost of goods for fab owners, capacity arrives two years after the capex that pays for it, and the terminal value is struck on mid-cycle cash flow. A reverse DCF reads the margin and the growth a price requires, and the sensitivity grids re-run the model in every cell.
See what's in the Semiconductors Sector Primer →£25 PDF · £59 with the Excel model · £159 for all three Technology industries
Frequently Asked Questions
- How are days of inventory calculated for chip companies?
- Year-end inventory divided by cost of revenue, times 365. That calculation recomputes from one filing. Where a company states its own days on a different basis, show both figures and label each basis.
- Which chip company holds the most inventory days?
- In this six-filer set on year-end balances, ASML held 271 days in FY2025 and Texas Instruments 231 days (the company states 222 on its own basis). TSMC was lowest at 69 days in FY2025.
- Why does ASML have so many inventory days?
- ASML builds complex systems that take many months to make and install, so tools in production sit in inventory: 271 days in FY2025. High days are not on their own a simple overstock signal; compare them with the company's own history and its order book.
- Why is Texas Instruments inventory high?
- FY2025 inventory was 231 days on year-end balances; the company states 222 days on its own basis. Both are correct on the basis stated. The level is a choice: the 10-K says the company builds its broad-based products ahead of demand to keep customer service high.
Read next
The Semiconductor Inventory Cycle
Chip revenue swings harder than end demand because customers build and drain inventory. WSTS history, Nvidia charges and Texas Instruments capacity.
Peak vs Mid-Cycle Margins for Chip Companies
A terminal year at peak margin overstates value. Filed margin swings and a worked mid-cycle example on a fictional chip company.
The Memory Pricing Cycle
DRAM and NAND are priced on bit supply against bit demand, so margins swing furthest. Micron filings show the trough and the peak.
Negative Cash Conversion Cycles in Hardware
How DIO, DSO and DPO combine into the cash conversion cycle, why some hardware brands run negative, and what one day of sales is worth on filed revenue.
See it applied
These company profiles apply the concepts from this guide to real public companies.