Technology · Semiconductors
The Semiconductor Inventory Cycle
Chip revenue swings harder than end demand because customers build and drain inventory. WSTS history, Nvidia charges and Texas Instruments capacity.
Selborne Research · Semiconductors coverage: 9 guides, 6 company profiles, a primer and Excel model
Educational analysis. This guide is not investment advice or a recommendation to buy or sell any security, and it is not personalised.
On this page
Chip Revenue Moves More Than End Demand
Customers and distributors order ahead when they fear shortages, then stop ordering while they burn stock. Chipmakers ship into the build and then into the drain. End demand for phones, PCs and servers can be almost flat while chip revenue jumps or collapses. That gap is the inventory cycle.
The same pattern shows up in three places: worldwide chip sales growth from World Semiconductor Trade Statistics (WSTS), a fabless designer writing down inventory and purchase commitments, and an analog maker holding high inventory by choice.
Worldwide Chip Sales Swing From Decline to Boom
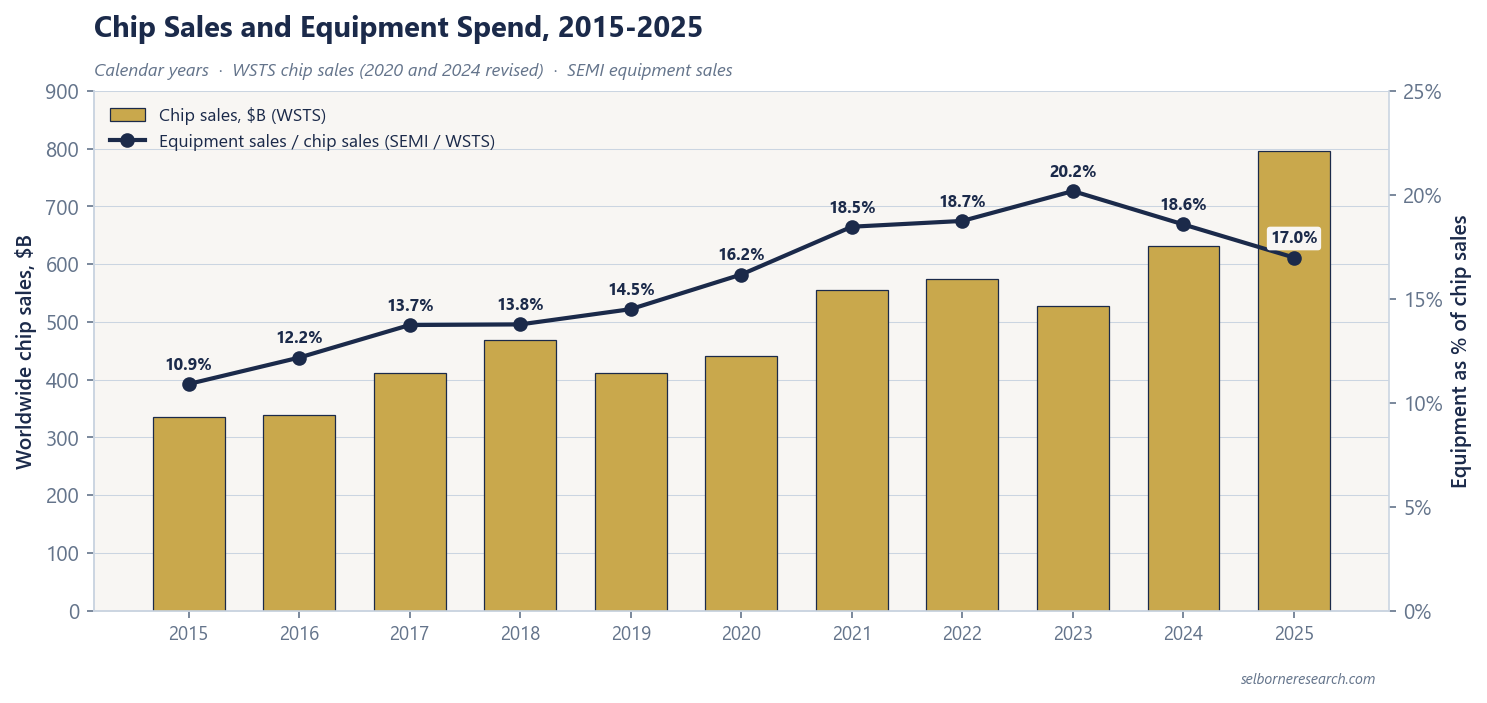
WSTS chip sales ran from $335.2B in calendar 2015 to $795.6B in 2025. Year-on-year growth in that window spanned -12.1% to +26.2%. Two of the ten years were declines.
| Calendar year | Chip sales ($B) | Year-on-year growth |
|---|---|---|
| 2015 | 335.2 | |
| 2016 | 338.9 | +1.1% |
| 2017 | 412.2 | +21.6% |
| 2018 | 468.8 | +13.7% |
| 2019 | 412.1 | -12.1% |
| 2020 | 440.4 | +6.9% |
| 2021 | 555.9 | +26.2% |
| 2022 | 574.1 | +3.3% |
| 2023 | 526.8 | -8.2% |
| 2024 | 630.5 | +19.7% |
| 2025 | 795.6 | +26.2% |
Growth rates are arithmetic from the WSTS levels. The trough years (2019 and 2023) sit next to boom years; a model that treats the latest year as normal will mis-state the mid-cycle run rate. Peak versus mid-cycle margins picks up that terminal-year trap.
Equipment spending follows the same chip market with a lag and a lead of its own; see the wafer fab equipment cycle. Equipment sales ran from 10.9% of chip sales in 2015 to a peak of 20.2% in 2023, the line on the chart below.
A Fabless Designer Absorbs the Channel
Nvidia designs chips and buys wafers; it does not own the fab. When customers cut orders, finished goods and purchase commitments become charges against gross profit. In FY2023 the company recorded inventory and purchase-commitment charges of about $2.2B ($1.04B plus $1.13B). Gross margin that year was 56.9%. By FY2025 gross margin was 75.0%.
At the FY2026 year-end (25 January 2026) Nvidia still carried manufacturing and supply commitments of $95.2B against inventory of $21.4B. Commitments are not inventory days, but they are the same cycle written as contracted purchases rather than finished goods on the balance sheet.
An Analog Maker Carries Inventory by Choice
Texas Instruments is the opposite posture. Its 10-K describes a strategy of building broad-based products ahead of demand to keep customer service high. Inventory on year-end balances was 231 days of cost of revenue in FY2025; the company states 222 days on its own basis. Both figures are correct on the basis stated. The same years carry what the 10-K calls a six-year elevated capital expenditures cycle, a 300mm fab build: capex rose from $0.5B in FY2016 to $5.1B in FY2023, and FY2025 capex was still $4.6B, or 25.7% of revenue.
Read those days against the company’s stated strategy and its own history, not against a foundry’s. Days of inventory by chip company ranks the peer set so the TI posture sits beside foundry, memory and equipment names.
How to Read Inventory Days in the Cycle
Rising days ahead of falling revenue is the early warning. Falling days into a shortage can mean the channel is empty and the next orders will be sharp. Absolute days also differ by business model: a foundry running wafers for customers holds fewer days of inventory than an equipment maker or an analog IDM.
| Signal | What it usually means |
|---|---|
| Days rising while revenue still grows | Channel or company stock building ahead of a turn |
| Days high by design | Stock built ahead of demand; check the company’s stated strategy and its own history |
| Large purchase commitments vs inventory | Fabless exposure to wafers not yet received |
| Revenue down more than end demand | Destocking, not only weaker system shipments |
Memory pricing is a separate lever: bit supply against bit demand can swing margins even when inventory days look calm.
What the Cycle Does to a Model
Strike a terminal year on peak margin or peak unit growth and the value overstates the business that has to live through the next destock. Average margin and capital intensity across one full cycle, and treat inventory days as a cycle variable rather than a constant. The filings above are worked illustrations of that method for the fiscal years shown.
Inventory days and commitment charges are cycle inputs; the primer runs them through a multi-period model that normalises earnings across a full chip cycle.
- 17 sections, from the business models and the industry cycle to capital intensity, memory, inventory, equipment orders, stock pay and a reverse DCF
- 44 pages
- a chip designer, a foundry, a memory maker and an equipment maker, all fictional
- 4 worked valuations
- listed chip companies on filed margins, capital intensity, inventory days and stock pay, each with its fiscal year
- 6-company screen
The Excel model is the primer's through-cycle DCF live across 13 sheets: a chip designer, a foundry, a memory maker and an equipment maker, all fictional, plus a column for a company of your own in any of five business-model modes. Each mode turns the industry cycle into revenue its own way: units and selling prices, capacity times utilisation times revenue per wafer, bit demand against bit supply, orders and installed-base services, or wafer starts for a materials supplier. Depreciation sits in cost of goods for fab owners, capacity arrives two years after the capex that pays for it, and the terminal value is struck on mid-cycle cash flow. A reverse DCF reads the margin and the growth a price requires, and the sensitivity grids re-run the model in every cell.
See what's in the Semiconductors Sector Primer →£25 PDF · £59 with the Excel model · £159 for all three Technology industries
Frequently Asked Questions
- Why does chip revenue swing harder than end demand?
- Customers and distributors build inventory when they fear shortages and drain it when they fear gluts. Chipmakers ship into that build and then into the drain, so their revenue moves more than the underlying demand for finished systems.
- What is a typical range for worldwide chip sales growth?
- World Semiconductor Trade Statistics figures for calendar 2015 to 2025 show year-on-year chip sales growth from -12.1% to +26.2%. Two of those ten years were declines.
- How did inventory charges hit Nvidia in FY2023?
- Nvidia recorded about $2.2B of inventory and purchase-commitment charges in FY2023 ($1.04B plus $1.13B). Gross margin that year was 56.9%, against 75.0% in FY2025.
- Why does Texas Instruments hold so many days of inventory?
- On year-end balances its FY2025 inventory was 231 days of cost of revenue; the company states 222 days on its own basis. The level is deliberate: its 10-K says the company builds broad-based products ahead of demand to keep customer service high.
Read next
Days of Inventory by Chip Company
Ranked days of inventory for six chip filers from year-end balances, with DSO, DPO and fiscal year. Business model explains most of the spread.
Peak vs Mid-Cycle Margins for Chip Companies
A terminal year at peak margin overstates value. Filed margin swings and a worked mid-cycle example on a fictional chip company.
The Memory Pricing Cycle
DRAM and NAND are priced on bit supply against bit demand, so margins swing furthest. Micron filings show the trough and the peak.
The Wafer Fab Equipment Cycle
Equipment spend follows chipmaker capex, so it lags and leads the chip cycle. SEMI history and ASML backlog, bookings and service share.
See it applied
These company profiles apply the concepts from this guide to real public companies.