Technology · Technology Hardware
Mid-Cycle Margins for Hardware Companies
A single year misleads for a cyclical hardware maker. How to average gross margin across a full cycle, with Seagate FY2016-FY2026 as the worked case.
Selborne Research · Technology Hardware coverage: 8 guides, 7 company profiles, a primer and Excel model
Educational analysis. This guide is not investment advice or a recommendation to buy or sell any security, and it is not personalised.
On this page
Average Across the Cycle; Do Not Set the Terminal on a Peak Year
A cyclical hardware maker can print a gross margin in a peak year that is nowhere near what the business earns in a normal year of the cycle. Average margin across one full cycle and strike a terminal value on that mid-cycle earning power. Do not strike it on the final explicit year alone if that year sits at a peak or a trough.
Seagate Technology is the worked case: a hard-drive maker whose filed gross margin swung from 18.3% to 45.6% inside a decade. Revenue fell 44% from FY2022 to FY2024.
Seagate Gross Margin, FY2016-FY2026
| Fiscal year | Gross margin |
|---|---|
| FY2016 | 23.4% |
| FY2017 | 29.5% |
| FY2018 | 30.1% |
| FY2019 | 28.2% |
| FY2020 | 27.0% |
| FY2021 | 27.3% |
| FY2022 | 29.7% |
| FY2023 | 18.3% |
| FY2024 | 23.4% |
| FY2025 | 35.2% |
| FY2026 | 45.6% |
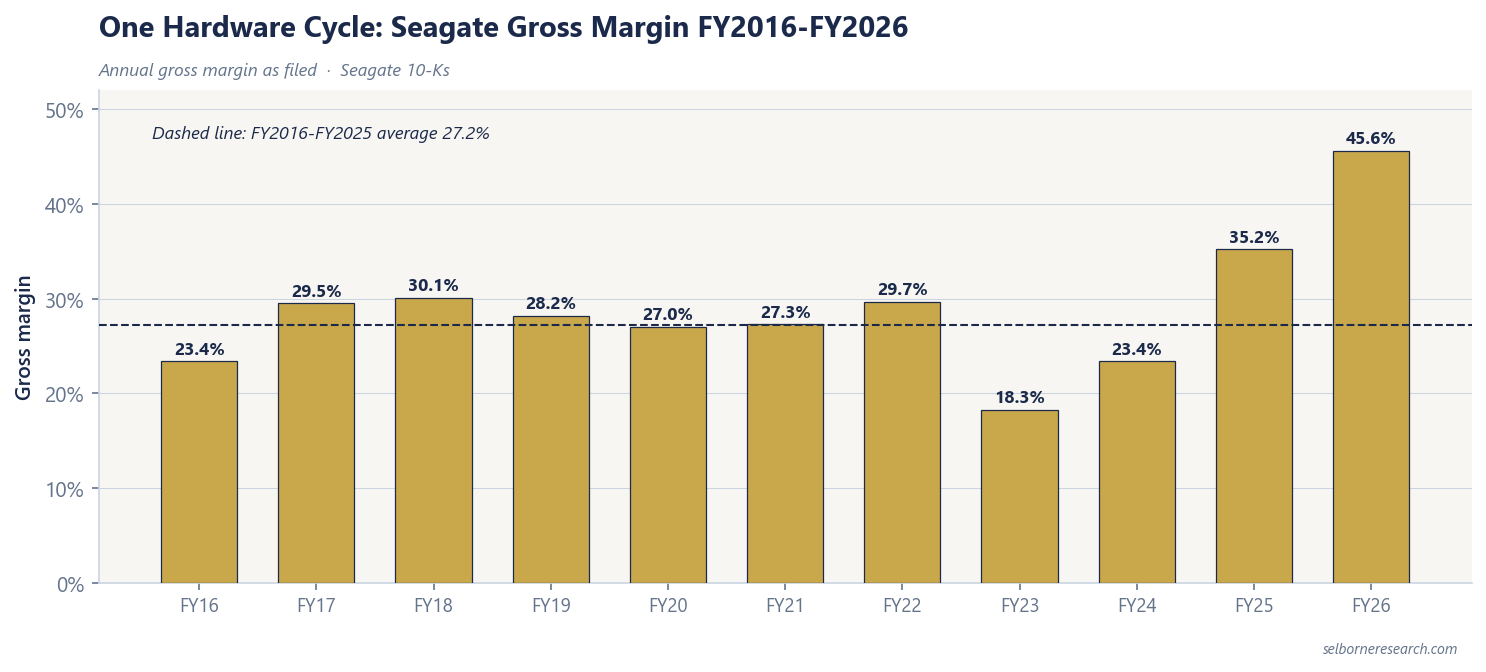
FY2026 at 45.6% and FY2023 at 18.3% are the same company on different points of the cycle. Taking either year as “the” margin without a cycle average misstates normal earning power.
Two Windows, Two Averages
| Window | Average gross margin |
|---|---|
| FY2016-FY2025 (ten years) | 27.2% |
| FY2017-FY2026 (ten years) | 29.4% |
Both averages use the filed series above. Including the FY2026 peak and dropping FY2016 lifts the ten-year mean from 27.2% to 29.4%. The mid-cycle answer is therefore a band around the high twenties, not a single printed year.
Revenue context for the trough: sales fell from $11,661M in FY2022 to $6,551M in FY2024. That is a 43.8% decline, or 44% when rounded. Margin and volume moved together.
How to Build a Mid-Cycle Margin
- Pull annual gross (or operating) margin for at least one full cycle from the filings or a consistent XBRL series.
- Average the series; state the window (start year, end year, number of years).
- Test a second window that shifts one year in each direction if the last year is an obvious peak or trough.
- Place the latest year against that average before using it in a forecast.
- Keep volume in view: Seagate’s 44% revenue fall is part of the same cycle that produced the 18.3% trough margin.
The width of the annual range across peers is a separate ladder in Gross Margin Ranges in Hardware Since FY2016. Product-versus-services mix, which may help explain some of the spread, is in Hardware Product vs Services Gross Margin, and the shipment cycles that drive unit volume sit in PC and Smartphone Replacement Cycles. Chip makers use the same mid-cycle idea in Peak vs Mid-Cycle Margins for Chip Companies.
Where Single-Year Thinking Fails
Using FY2026’s 45.6% as a steady-state Seagate margin ignores a decade in which the same line spent years near the high twenties and one year at 18.3%. Using FY2023’s 18.3% as the permanent margin ignores the recovery that followed.
Mid-cycle normalisation does not predict the next peak. It stops a model from treating a peak or trough print as the continuing rate.
Technology Hardware Sector Primer
The primer strikes terminal value on mid-cycle free cash flow so a peak or trough final year does not set the continuing value in the multi-period model.
- 17 sections, from units, price and the product cycle to working capital in days, mid-cycle margins and a reverse DCF
- 43 pages
- a device brand, a networking maker, a contract manufacturer and a storage maker, all fictional
- 4 worked valuations
- listed hardware makers on filed margins, working-capital days and purchase commitments, each with its fiscal year
- 7-company screen
The Excel model is the primer's product-cycle DCF live across 13 sheets: a device brand, a networking maker, a contract manufacturer and a storage maker, all fictional, plus a column for a company of your own in any of five business-model modes. Revenue is built from trend units, a yearly cycle index and price, with a recurring line on the installed base and an order book for networking; gross margin carries a fixed share of cost of goods, so it rises and falls with the cycle; working capital runs in days; capex funds growth; and the terminal value is struck on mid-cycle cash flow. A reverse DCF reads the margin and the unit growth a price requires, and the sensitivity grids re-run the model in every cell. Change the cycle, the days or the margin and the value moves.
See what's in the Technology Hardware Sector Primer →£25 PDF · £59 with the Excel model · £159 for all three Technology industries
Frequently Asked Questions
- What is a mid-cycle margin for a hardware company?
- A mid-cycle margin is the average gross or operating margin across one full product or demand cycle, not the margin in the latest year alone. Cyclical makers can print a peak year that overstates normal earning power and a trough year that understates it.
- Why not value a cyclical hardware company on the latest year?
- The latest year may sit at a peak or a trough. Seagate gross margin ran from 18.3% in FY2023 to 45.6% in FY2026. A terminal value struck on either endpoint misstates the cash the business earns in a normal year of the cycle.
- What mid-cycle gross margin does Seagate history imply?
- On the filed FY2016-FY2026 gross margin series, the ten-year average is 27.2% for FY2016-FY2025 and 29.4% for FY2017-FY2026. The window choice moves the average by a little over two points.
- How far did Seagate revenue fall in the last downturn?
- Seagate revenue fell 44% from FY2022 to FY2024 ($11,661M to $6,551M, a 43.8% decline). Gross margin in that trough reached 18.3% in FY2023 before recovering in later years.
Read next
Gross Margin Ranges in Hardware Since FY2016
Hardware filers ranked by the width of their annual gross margin range since FY2016, an operating read of cyclicality with windows labelled where they differ.
Hardware Product vs Services Gross Margin
Services earn a far higher gross margin than hardware products, so mix moves the company margin. Filed product and services margins from four filers.
PC and Smartphone Replacement Cycles
PC and smartphone shipments follow refresh cycles. Shipment history, replacement lives, and how to turn a cycle into a unit curve in a model.
Peak vs Mid-Cycle Margins for Chip Companies
A terminal year at peak margin overstates value. Filed margin swings and a worked mid-cycle example on a fictional chip company.
See it applied
These company profiles apply the concepts from this guide to real public companies.
Also in Technology Hardware
- Negative Cash Conversion Cycles in Hardware
- Cash Conversion Cycle by Hardware Company
- Purchase Commitments vs Inventory in Hardware
- EMS Economics: Thin Margins and ROIC
- Mid-Cycle Margins for Hardware Companies
- Gross Margin Ranges in Hardware Since FY2016
- Hardware Product vs Services Gross Margin
- PC and Smartphone Replacement Cycles