Technology · Technology Hardware
PC and Smartphone Replacement Cycles
PC and smartphone shipments follow refresh cycles. Shipment history, replacement lives, and how to turn a cycle into a unit curve in a model.
Selborne Research · Technology Hardware coverage: 8 guides, 7 company profiles, a primer and Excel model
Educational analysis. This guide is not investment advice or a recommendation to buy or sell any security, and it is not personalised.
On this page
Shipments Follow Refresh Cycles
PC and smartphone unit sales rise and fall with replacement timing. A cluster of devices bought in one boom year comes due for refresh together; when that wave passes, shipments can fall even if the installed base is still large. The modelling job is to turn that history into a unit curve. Trend growth sets the slow path and a cycle index multiplies around it. The installed base then rolls forward on an average life.
Two replacement-life facts can anchor the lives used in that build. Counterpoint Research put the smartphone replacement cycle at 43.0 months in 2024. IDC described US commercial PCs as replaced every 3.5 to 4 years (2023 Technology Spotlight).
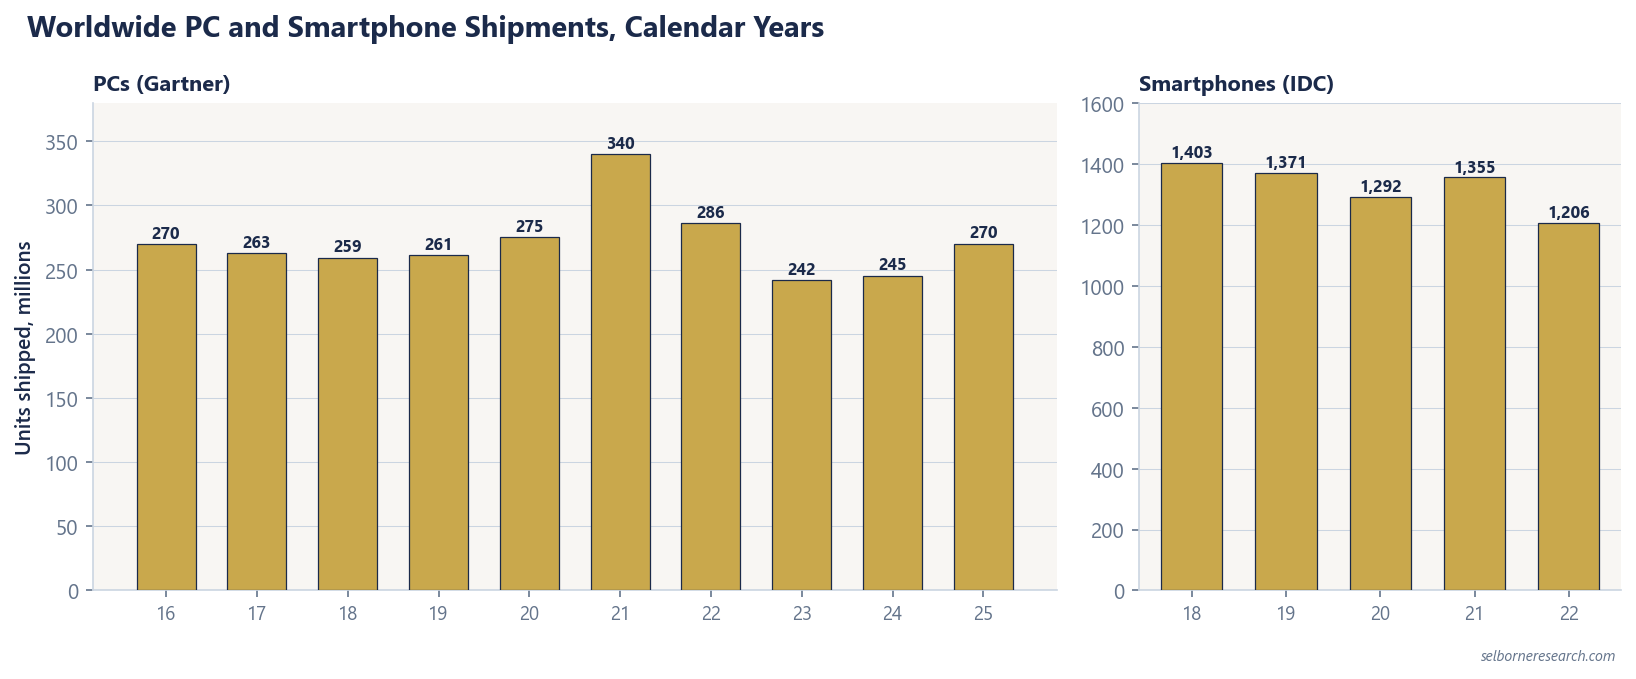
Worldwide PC Shipments
Gartner January releases, calendar years 2016-2025 (millions of units):
| Year | PC shipments (M) |
|---|---|
| 2016 | 269.7 |
| 2017 | 262.5 |
| 2018 | 259.4 |
| 2019 | 261.2 |
| 2020 | 275.1 |
| 2021 | 339.8 |
| 2022 | 286.2 |
| 2023 | 241.9 |
| 2024 | 245.4 |
| 2025 | 270.2 |
The 2021 peak of 339.8M fell to 241.9M in 2023, a 28.8% decline. By 2025 shipments had recovered to 270.2M, still below the 2021 peak.
Worldwide Smartphone Shipments
IDC releases on Business Wire cover calendar years 2018-2022 on a consistent primary-source basis (millions of units):
| Year | Smartphone shipments (M) |
|---|---|
| 2018 | 1,402.6 |
| 2019 | 1,371.0 |
| 2020 | 1,292.2 |
| 2021 | 1,354.8 |
| 2022 | 1,205.5 |
From 2019 to 2022 the series fell 12.1% (1,371.0M to 1,205.5M). The 2021 rebound did not hold into 2022.
From Cycle Facts to a Unit Curve
A practical device build has three moving pieces:
- Trend units. A slow growth rate for the category (population, computing intensity), separate from the cycle.
- Cycle index. A yearly multiplier around 1.00 that rises into a refresh peak and falls into a trough. PC history shows a 28.8% peak-to-trough move from 2021 to 2023; smartphones show a 12.1% decline from 2019 to 2022. Those amplitudes size how violent the index can be.
- Installed base. Opening base, plus new units, minus retirements at 1 / average life. Smartphones at about 43 months imply a life near three and a half years; US commercial PCs at 3.5-4 years sit in the same neighbourhood. Recurring services then ride that base (Hardware Product vs Services Gross Margin).
Device brands such as Apple and PC sellers such as Dell Technologies feel the unit swing first in product revenue. Margins on cyclical hardware without a large services cushion need a mid-cycle read (Mid-Cycle Margins for Hardware Companies). Build plans sized at a peak also show up later as purchase commitments (Purchase Commitments vs Inventory in Hardware).
What the History Is For
The shipment tables are not a forecast. They show that a single year of units is a poor stand-in for normal demand when the category just came off a 28.8% PC decline or a 12.1% smartphone decline. A model that ignores replacement timing will treat a trough as permanent or a peak as a new floor.
Use the lives (43.0 months for smartphones; 3.5-4 years for US commercial PCs) to retire the installed base and the shipment amplitudes to stress the cycle index. Keep category data (Gartner for PCs, IDC for smartphones) labelled by source and calendar year.
Technology Hardware Sector Primer
The primer turns replacement lives and shipment history into a product-cycle unit index that drives the multi-period device revenue build.
- 17 sections, from units, price and the product cycle to working capital in days, mid-cycle margins and a reverse DCF
- 43 pages
- a device brand, a networking maker, a contract manufacturer and a storage maker, all fictional
- 4 worked valuations
- listed hardware makers on filed margins, working-capital days and purchase commitments, each with its fiscal year
- 7-company screen
The Excel model is the primer's product-cycle DCF live across 13 sheets: a device brand, a networking maker, a contract manufacturer and a storage maker, all fictional, plus a column for a company of your own in any of five business-model modes. Revenue is built from trend units, a yearly cycle index and price, with a recurring line on the installed base and an order book for networking; gross margin carries a fixed share of cost of goods, so it rises and falls with the cycle; working capital runs in days; capex funds growth; and the terminal value is struck on mid-cycle cash flow. A reverse DCF reads the margin and the unit growth a price requires, and the sensitivity grids re-run the model in every cell. Change the cycle, the days or the margin and the value moves.
See what's in the Technology Hardware Sector Primer →£25 PDF · £59 with the Excel model · £159 for all three Technology industries
Frequently Asked Questions
- How long is the smartphone replacement cycle?
- Counterpoint Research put the smartphone replacement cycle at 43.0 months in 2024. That life sets how fast the installed base turns over when new unit sales are flat.
- How long is the US commercial PC replacement cycle?
- IDC described US commercial PCs as replaced every 3.5 to 4 years in its 2023 Technology Spotlight. Enterprise refresh programmes often cluster around that window rather than a smooth annual rate.
- How far did PC shipments fall after the 2021 peak?
- Worldwide PC shipments rose to 339.8M in 2021 and fell to 241.9M in 2023, a 28.8% decline, per Gartner January releases. Shipments then recovered to 270.2M in 2025.
- How far did smartphone shipments fall from 2019 to 2022?
- Worldwide smartphone shipments fell from 1,371.0M in 2019 to 1,205.5M in 2022, a 12.1% decline, per IDC releases. That trough followed a 2021 rebound to 1,354.8M.
Read next
Mid-Cycle Margins for Hardware Companies
A single year misleads for a cyclical hardware maker. How to average gross margin across a full cycle, with Seagate FY2016-FY2026 as the worked case.
Hardware Product vs Services Gross Margin
Services earn a far higher gross margin than hardware products, so mix moves the company margin. Filed product and services margins from four filers.
Purchase Commitments vs Inventory in Hardware
Inventory sits on the balance sheet; purchase commitments sit off it and can dwarf it. Filer definitions differ, and write-downs follow a demand drop.
See it applied
These company profiles apply the concepts from this guide to real public companies.
Also in Technology Hardware
- Negative Cash Conversion Cycles in Hardware
- Cash Conversion Cycle by Hardware Company
- Purchase Commitments vs Inventory in Hardware
- EMS Economics: Thin Margins and ROIC
- Mid-Cycle Margins for Hardware Companies
- Gross Margin Ranges in Hardware Since FY2016
- Hardware Product vs Services Gross Margin
- PC and Smartphone Replacement Cycles