Defence & Aerospace · Defence Primes
Defence Prime Segment Margin Benchmarks
FY2025 segment operating margins ranked across 24 businesses at LMT, RTX, NOC, GD, LHX and BAE, with each filer's margin basis stated beside the figure.
Selborne Research · Defence Primes coverage: 9 guides, 6 company profiles, a primer and Excel model
Educational analysis. This guide is not investment advice or a recommendation to buy or sell any security, and it is not personalised.
On this page
Margins Vary More Inside One Prime Than Between Primes
Five of the six defence primes we track (the contractors that hold the main government programmes) reported FY2025 company-level margins between 9.0% and 11.8%. Inside each company, the spread is two or three times wider. Lockheed Martin ran from 6.9% in Aeronautics to 13.8% in Missiles & Fire Control, Northrop Grumman from 6.3% to 14.6% and BAE Systems from 6.7% to 15.4%.
What a segment builds sets its margin far more than which prime owns it. This guide ranks all 24 reporting segments across the six filers on FY2025 figures, with each filer’s own margin basis beside the number.
FY2025 Segment Operating Margins, Ranked
Every figure is segment operating profit divided by sales from each company’s FY2025 results, on the basis shown in the right-hand column (ROS is RTX’s return on sales). L3Harris states both a GAAP and an adjusted figure; the table uses GAAP to keep adjustments out.
| Rank | Company | Segment | FY2025 margin | Basis |
|---|---|---|---|---|
| 1 | L3Harris | Communication Systems | 25.2% | GAAP (adjusted also 25.2%) |
| 2 | RTX | Collins Aerospace | 16.3% | Reported ROS |
| 3 | BAE Systems | Electronic Systems | 15.4% | Underlying EBIT ÷ sales |
| 4 | Northrop Grumman | Mission Systems | 14.6% | Segment operating margin |
| 5 | General Dynamics | Combat Systems | 14.4% | Segment operating margin |
| 6 | Lockheed Martin | Missiles & Fire Control | 13.8% | Segment operating margin |
| 7 | General Dynamics | Aerospace | 13.3% | Segment operating margin |
| 8 | L3Harris | Space & Airborne Systems | 12.3% | GAAP |
| 9 | L3Harris | Integrated Mission Systems | 12.2% | GAAP |
| 10 | BAE Systems | Air | 11.9% | Underlying EBIT ÷ sales |
| 11 | RTX | Raytheon | 11.5% | Reported ROS |
| 12 | BAE Systems | Platforms & Services | 11.4% | Underlying EBIT ÷ sales |
| 13 | Northrop Grumman | Space Systems | 11.0% | Segment operating margin |
| 14 | Northrop Grumman | Defense Systems | 10.9% | Segment operating margin |
| 15 | Lockheed Martin | Space | 10.3% | Segment operating margin |
| 16= | L3Harris | Aerojet Rocketdyne | 9.5% | GAAP (12.5% adjusted) |
| 16= | General Dynamics | Technologies | 9.5% | Segment operating margin |
| 18 | BAE Systems | Cyber & Intelligence | 9.3% | Underlying EBIT ÷ sales |
| 19 | RTX | Pratt & Whitney | 7.9% | Reported ROS |
| 20 | Lockheed Martin | Rotary & Mission Systems | 7.6% | Segment operating margin |
| 21 | General Dynamics | Marine Systems | 7.0% | Segment operating margin |
| 22 | Lockheed Martin | Aeronautics | 6.9% | Segment operating margin |
| 23 | BAE Systems | Maritime | 6.7% | Underlying EBIT ÷ sales |
| 24 | Northrop Grumman | Aeronautics Systems | 6.3% | Segment operating margin |
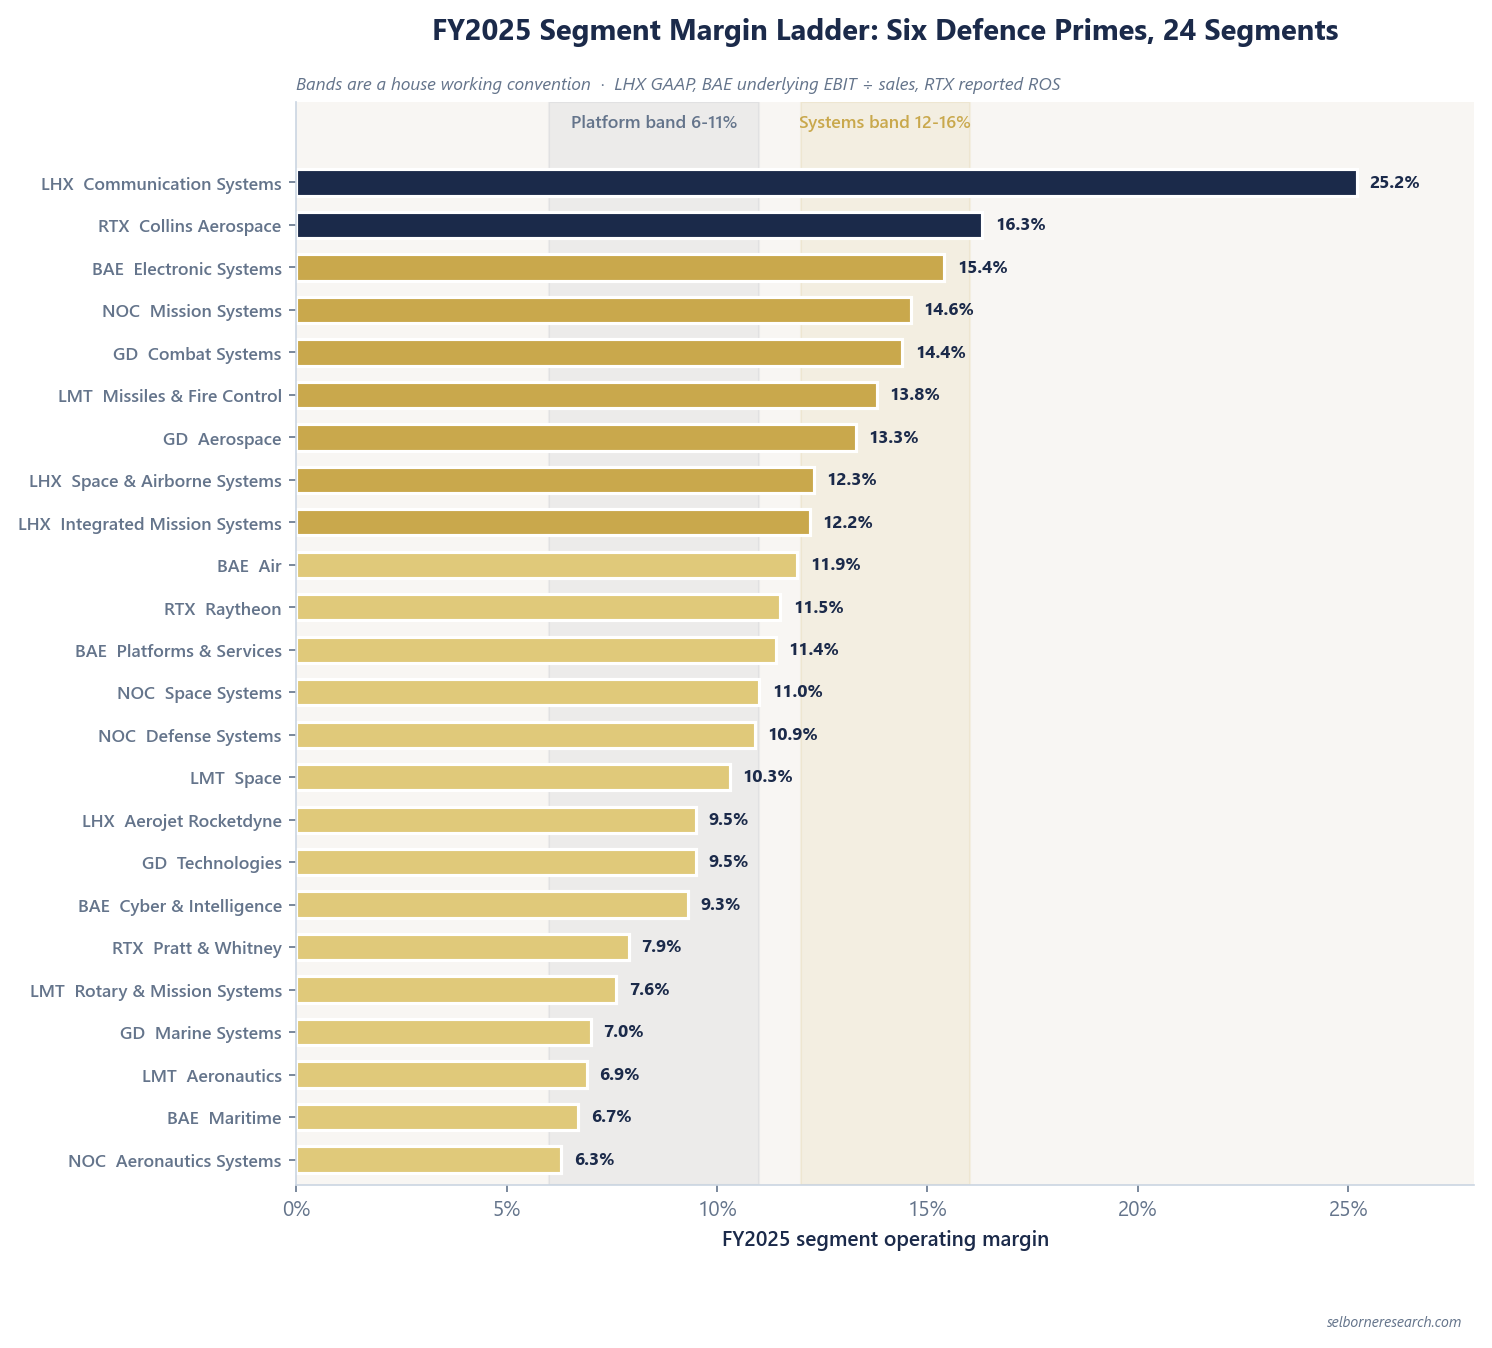
The table sorts largely by what gets built. The four lowest segments make military aircraft and ships, and at Lockheed Martin, Northrop Grumman, General Dynamics and BAE Systems that segment is the company’s lowest. The top six are mostly electronics, communications and missiles. BAE’s Air sector, at 11.9%, is the aircraft business that breaks the pattern.
Company Totals Sit in a Narrow Band
| Company | FY2025 company-level margin | Basis |
|---|---|---|
| L3Harris | 15.8% | Adjusted segment operating margin (GAAP operating margin 9.7%) |
| RTX | 11.8% | Total segment ROS |
| BAE Systems | 10.8% | Group underlying return on sales |
| Northrop Grumman | 10.4% | Segment operating margin |
| General Dynamics | 10.2% | Consolidated operating margin |
| Lockheed Martin | 9.0% | Total business segment operating margin |
L3Harris is the only one outside the 9.0-11.8% range, and its figure is the only adjusted one. On its GAAP operating margin of 9.7%, it sits with the others. General Dynamics is the reverse case: its 10.2% is consolidated, so it already carries corporate costs that the segment-level totals of the other US filers leave out.
Four Bases Sit Under One Column
The ranking mixes four definitions:
- Segment operating margin (Lockheed Martin, Northrop Grumman, General Dynamics): segment operating profit ÷ segment sales, before corporate costs.
- Return on sales (RTX): the same ratio under RTX’s own label.
- GAAP and adjusted (L3Harris): the adjusted figure removes items L3Harris lists in its non-GAAP reconciliation. For Communication Systems the two are identical. For Aerojet Rocketdyne, GAAP is 9.5% and adjusted is 12.5%, which is enough to move it from 16th to 8th.
- Underlying EBIT ÷ sales (BAE Systems): BAE’s own measure, which sits outside IFRS.
The US primes charge their segments the pension cost that government contracts allow, under Cost Accounting Standards (CAS). Their consolidated results use the US GAAP pension cost instead, and the gap between the two sits on a reconciling line between segment and consolidated profit. BAE reports under IFRS and has no such line. The FAS vs CAS guide walks through how large that line can get.
A margin is a ratio, so BAE’s sterling figures rank against the dollar filers without an FX rate.
Reading a Segment Against a Band
We read segment margins against two bands, our own unsourced working convention, set from this peer set’s spread:
| Band | Segment margin | Anchored on |
|---|---|---|
| Platform | 6-11% | The military aircraft and shipbuilding segments at the bottom of the table |
| Systems | 12-16% | The electronics, sensor, communications and missile segments near the top |
Nineteen of the 24 segments land in a band. Three fall in the one-point gap between them: BAE Air (11.9%), RTX’s Raytheon (11.5%) and BAE Platforms & Services (11.4%). Two sit above the systems band. L3Harris Communication Systems, at 25.2%, is almost nine points clear of anything else in the peer set. RTX’s Collins Aerospace, at 16.3%, sits just above it, inside a company that earns 48% of its revenue from commercial customers.
One segment fits its band but not the table. General Dynamics Aerospace, at 13.3%, is mainly Gulfstream business jets and Jet Aviation, a commercial business at 25% of GD’s revenue, so its place in a defence ranking needs a footnote.
A band places a margin against the peer spread; it does not name the work. Space and cyber segments also land in the platform band. Nor does a band say whether a margin is high or low for that work, or which way it is heading. Contract type matters too: a fixed-price production lot and a cost-plus development contract on the same platform can earn very different margins. The cost-plus vs fixed-price guide covers that trade-off.
Where a Naive Ranking Goes Wrong
One error is putting L3Harris’s 15.8% beside the other primes’ figures and reading it as the highest-margin prime. Its company figure is adjusted. On the GAAP basis it sits at 9.7%, inside the same range as the rest.
Another is reading one segment’s margin as the company’s. Lockheed Martin’s Aeronautics segment at 6.9% is largely one programme: F-35 is 67% of Aeronautics sales and 27% of Lockheed Martin’s total. That 6.9% says a lot about F-35 and little about Missiles & Fire Control at 13.8%.
The ranking also says nothing about size: a small segment at a high margin can earn fewer dollars than a large one at a low margin.
And margin is not cash. A prime can report steady segment margins while working capital or pension timing pulls its free cash flow well away from earnings. Check FCF conversion before drawing a conclusion about either.
Segment margin is the input that turns backlog into profit. This primer carries it through a ten-year cash-flow build and an FCF yield you can screen.
- 15 sections, backlog roll-forward to a discounted cash-flow value
- 44 pages
- platform prime (Meridian) and diversified systems (Vectra)
- 2 worked archetypes
- book-to-bill, FCF conversion, programme concentration, segment margin
- 6-company screen
The Excel model is the primer's two archetype builds live across 11 sheets: a ten-year, backlog-driven free-cash-flow DCF with a Gordon terminal. Change the book-to-bill, the FCF conversion ratio or the WACC and the value per share moves; the backlog, conversion-bridge and concentration sheets update alongside it.
See what's in the Defence Primes Sector Primer →£25 PDF · £59 with the Excel model · £159 for all three Defence & Aerospace industries
Frequently Asked Questions
- What operating margin do defence contractors make?
- Five of the six primes we track earned 9.0% to 11.8% at company level in FY2025, each on its own reported basis. L3Harris reports 15.8% on an adjusted basis but 9.7% on GAAP. Individual segments ranged far wider, from 6.3% to 25.2%.
- Which defence segment had the highest margin in FY2025?
- L3Harris Communication Systems, at 25.2% on both the GAAP and the adjusted basis, well clear of the next segment, RTX's Collins Aerospace at 16.3% reported return on sales. The other 23 segments we rank sit between 6.3% and 16.3%.
- Why do military aircraft segments earn the lowest margins?
- The bottom of the FY2025 table is aircraft and ship production: Northrop Grumman Aeronautics Systems 6.3%, BAE Maritime 6.7%, Lockheed Martin Aeronautics 6.9% and General Dynamics Marine Systems 7.0%. These are large platform programmes run at volume. At Lockheed Martin, F-35 alone is 67% of Aeronautics sales and 27% of the whole company, so one programme sets most of that segment's margin.
- Is segment operating margin the same as operating margin?
- No. Segment margin is measured before corporate costs and, at the US primes, before a pension adjustment that reconciles the pension cost charged to government contracts with the US GAAP pension cost. The gap can be large: L3Harris reported a 15.8% adjusted segment operating margin and a 9.7% GAAP operating margin for the same year. Compare segment with segment, and company with company.
Read next
Cost-Plus vs Fixed-Price Contracts
NOC cost-type vs FFP margin/risk language, verified portfolio mix (~50% fixed at NOC; GD 51% fixed / 44% cost-reimb), and segment margin dispersion across the peer set.
FAS vs CAS Pension Accounting
Why a defence prime books its pension cost twice, where the reconciling line sits between segment and consolidated profit, and how each filer defines it.
Free Cash Flow Conversion for Primes
Why primes screen on FCF ÷ net income: GD incentive weight 25%, OCF 122% vs FCF 94%, and the FY2025 ladder from LHX 170% to NOC 79%.
Defence Prime Book-to-Bill Benchmarks
FY2025 book-to-bill ranked across RTX, GD, LHX, LMT, BAE and NOC, each with backlog and the filer's own orders-to-revenue definition beside it.
See it applied
These company profiles apply the concepts from this guide to real public companies.
Also in Defence Primes
- Backlog and Book-to-Bill in Defence
- Defence Prime Book-to-Bill Benchmarks
- Defence Prime Segment Margin Benchmarks
- Funded vs Unfunded Backlog in Defence
- Free Cash Flow Conversion for Primes
- FAS vs CAS Pension Accounting for Defence Primes
- Cost-Plus vs Fixed-Price Contracts
- Defence Budgets and the Demand Cycle
- Valuing Defence Primes (FCF Yield)