Agribusiness · Fertilisers
Fertiliser Cost Curves Explained
How nitrogen, phosphate and potash cost curves are set by gas access, rock integration and ore grade, with FY2025 unit costs from Nutrien, Mosaic and Intrepid.
Selborne Research · Fertilisers coverage: 7 guides, 6 company profiles, a primer and Excel model
Educational analysis for professional use. This guide is not investment advice or a recommendation to buy or sell any security, and it is not personalised.
On this page
Three Curves, Not One
Each fertiliser nutrient has its own cost curve, which ranks producers from cheapest to dearest by the cost of a tonne, and a different input sets each one. Nitrogen’s is set by gas: plants on cheap US Henry Hub gas sit at the low end, plants paying European or imported gas prices at the high end. Phosphate’s is set by rock, sulphur and ammonia, and by whether the producer mines its own rock. Potash’s is set by ore grade, mine type, royalties and the freight to Brazil, the largest import market. A ranking that mixes the three means nothing.
FY2025 Disclosed Unit Costs
No two producers file the same cost measure, so the chart shows filed figures, not a cost curve. Nutrien reports a controllable cash cost of product manufactured (COPM), the plant costs its managers control. Mosaic reports a cash cost. Intrepid Potash reports cost of goods sold (COGS) per short ton of 2,000 lb (0.907 metric tonnes), converted here to metric tonnes.
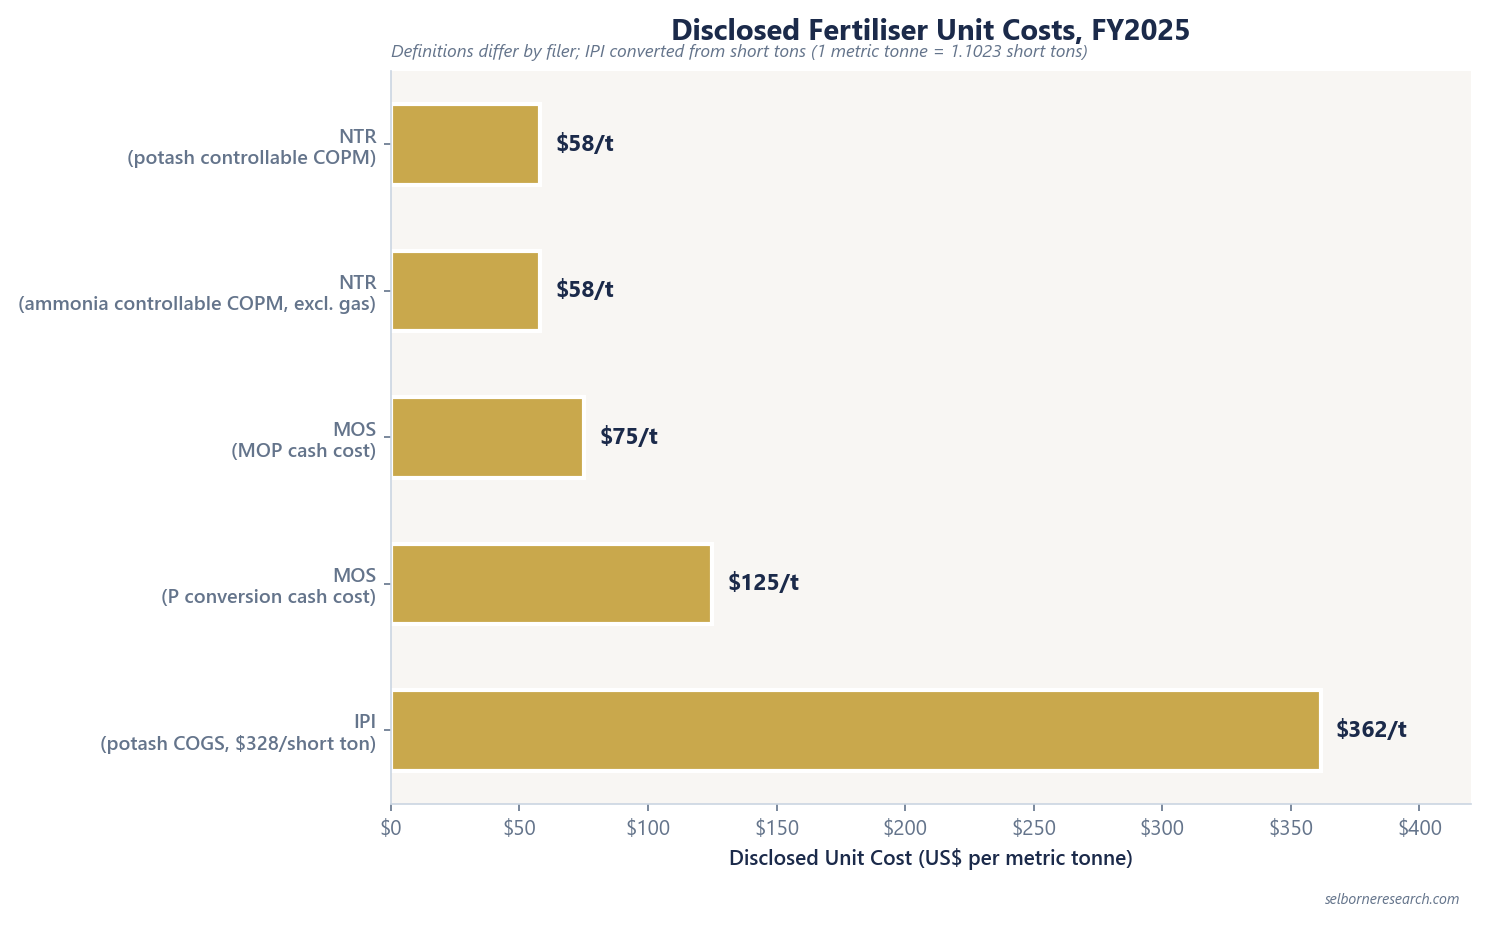
| Producer | Nutrient / step | Disclosed cost | Definition |
|---|---|---|---|
| Nutrien | Potash | $58/t | Controllable cash COPM; excludes depreciation, royalties, gas, carbon taxes |
| Nutrien | Ammonia | $58/t | Controllable cash COPM; excludes depreciation, gas and steam |
| Mosaic | Potash (MOP) | $75/t | Cash cost of production |
| Mosaic | Phosphate conversion | $125/t | Cash cost of conversion |
| Intrepid Potash | Potash | $328/st (about $362/t) | COGS per short ton, including depreciation |
Nutrien’s ammonia figure leaves out gas, the largest cost of making ammonia, so it says little about where Nutrien sits on the nitrogen curve.
The Nitrogen Curve: Gas Access
CF and Yara file no cash cost per tonne, so the nitrogen curve is read through what each producer pays for its gas, in dollars per MMBtu (million British thermal units, the unit gas is priced in).
| Producer | FY2025 gas cost | Gas market |
|---|---|---|
| CF Industries | $3.31/MMBtu | US, linked to Henry Hub |
| Nutrien (nitrogen) | $3.53/MMBtu | North America |
| Yara (global) | $10.0/MMBtu | Weighted average of all its plants |
| Yara (Europe) | $13.2/MMBtu | European gas and imported LNG (liquefied gas shipped by sea) |
A tonne of ammonia takes about 36 MMBtu of gas, the figure in Yara’s Fertilizer Industry Handbook. At that rate CF’s gas cost $119 a tonne in FY2025 and Yara Europe’s $475, a gap of $356/t. Both sell into one world market, so at the same ammonia price the whole gap shows up in margin. The gas and nitrogen guide builds the rest of the cost.
The Phosphate Curve: Rock Integration
Owning the rock and making some of its own ammonia cushions a phosphate producer against input prices without removing them. DAP (diammonium phosphate), the benchmark phosphate fertiliser, is made by treating phosphate rock with sulphur and ammonia. Mosaic’s FY2025 filings give the cost of each input:
| Mosaic Phosphates, FY2025 | Cost |
|---|---|
| Rock, per tonne of rock (a blend of rock it mines and rock it buys) | $80/t |
| Sulphur, per long ton (1.016 tonnes), first to last quarter of 2025 | $157 to $306 |
| Ammonia consumed, per tonne of ammonia | $468/t |
| Conversion (plant cash cost, before raw materials), per tonne of product | $125/t |
| Realised DAP price at the plant, per tonne | $670/t |
Each input is priced per tonne of itself. Per tonne of DAP, Mosaic’s 10-K gives 1.6-1.7 t of rock, about 0.40 long tons of sulphur and about 0.23 t of ammonia. At 1.65 t of rock and the average 2025 sulphur cost of $236, that is about $132 of rock, $94 of sulphur and $108 of ammonia, plus $125 of conversion: $459 a tonne before freight and overheads, against the $670 price.
Mosaic makes part of its ammonia at its own Faustina plant and buys the rest. Its gas exposure comes through that ammonia and through the fuel burnt at its potash solution mine, which dissolves potash underground and pumps it to the surface.
The Potash Curve: Ore and Freight
A potash price and a potash cost compare only when both are measured at the same place. The benchmark is granular MOP (muriate of potash, the standard potash product) CFR Brazil, meaning landed at a Brazilian port with the sea freight paid, which averaged $347.5/t in 2025 (World Bank). Mosaic realised $255/t FOB mine, at the mine before freight. The $92/t between the World Bank’s figure and Mosaic’s is mostly freight and handling to Brazil, with contract timing and customer mix inside it too.
| FY2025 | Realised potash price | Potash produced |
|---|---|---|
| Nutrien | $252/t, net of freight | 13.97M t |
| Mosaic | $255/t at the mine | 8.8M t |
| ICL | $333/t CIF, delivered to the customer’s port | 4.38M t |
| Intrepid Potash | $353/st, net of freight | 280,000 st |
ICL files no potash cost. Intrepid’s price less its COGS is not a margin. The price counts potash sales only, while the COGS spreads the whole segment’s costs, including the salt and brines it sells on the side, over potash tons alone. Its filed potash segment gross margin was $18.2M, or $63 a short ton sold.
The Excel model that comes with the primer keeps price and cost on one basis. Its fictional potash producer sells at a long-run $340/t CFR Brazil, so its cost is carried to Brazil too: mine cash cost $75/t, royalties and resource taxes $35/t and freight $90/t, $200/t in all, for a margin of $140/t. Set the $75/t mine cost alone against the Brazil price and the margin reads $265/t, nearly double, because the freight, royalties and taxes all count as profit.
What Each Cost Leaves Out
Most errors in fertiliser cost work come from setting side by side two costs that leave out different things. Mosaic’s cash costs leave out depreciation, and each segment footnote lists the rest. Intrepid’s COGS includes depreciation but leaves out freight and warehousing, which it reports separately.
Nutrien publishes cost curves in its investor materials and CF publishes nitrogen cost-curve charts. Where a producer files no cost, industry-wide curves from CRU, a price reporting agency, fill the gap, but they do not place a named company.
Linking Curves to Valuation
A cost-curve position sets how wide a producer’s margin is at a given price. Earnings still need rebuilding at a normal price. At the same urea price, a plant on $3/MMBtu gas earns a wider margin than a European plant on $13/MMBtu. The mid-cycle earnings guide does that rebuild.
Four hypothetical producers, in US nitrogen, European nitrogen, phosphate and potash, valued year by year as nutrient prices recover to mid-cycle, set beside the through-cycle multiple.
- 15 sections, from how a nutrient producer earns to a year-by-year DCF and leverage on mid-cycle EBITDA
- 43 pages
- a US nitrogen producer on Henry Hub gas, a European nitrogen producer, a phosphate producer and a potash miner
- 4 producer engines
- listed nitrogen, phosphate and potash producers on filed FY2025 figures
- 6-company screen
The Excel model is the primer's mid-cycle valuation live across 13 sheets: four producer tabs (US nitrogen on Henry Hub gas, European nitrogen, phosphate and potash), each walking nutrient prices from the starting point back to mid-cycle through a ten-year free-cash-flow schedule with working capital and sustaining capex; a valuation summary setting each DCF beside the multiple cross-check and splitting the gap between them; cycle scenarios, a cost curve with a gas cost curve, a leverage screen on mid-cycle EBITDA and two live sensitivity grids, urea price against the exit multiple and against the gas price. Change the nutrient price, the gas price or the WACC and the value moves.
See what's in the Fertilisers Sector Primer →£25 PDF · £59 with the Excel model · £159 for all three Agribusiness industries
Frequently Asked Questions
- What sets the global nitrogen fertiliser cost curve?
- The price of gas, from which ammonia, the base of every nitrogen fertiliser, is made. In FY2025 CF Industries paid $3.31 per MMBtu (million British thermal units) and Nutrien's nitrogen plants $3.53, against Yara's $10.0 worldwide and $13.2 in Europe. Where a plant buys its gas matters more than how efficient it is.
- How do phosphate and potash cost curves differ from nitrogen?
- Phosphate cost depends on rock, sulphur and ammonia: in FY2025 Mosaic's conversion cash cost was $125/t, with blended rock at $80/t and ammonia at $468/t. Potash cost depends on ore grade, mine type, royalties and freight: Mosaic's cash cost was $75/t, Nutrien's controllable cost $58/t, and Intrepid Potash's broader cost of goods sold $328 per short ton (about $362/t).
- Why can't you compare controllable COPM to COGS per ton directly?
- Each leaves out different costs. Nutrien's controllable cash cost of product manufactured (COPM) excludes depreciation, royalties, gas and carbon taxes; Intrepid's cost of goods sold per short ton includes depreciation. Label the definition and the unit on every figure before comparing.
- Do CF Industries and Yara disclose cash cost per tonne?
- No. Use realised gas cost, gross margin or EBITDA per ton instead: CF earned $152 of adjusted EBITDA per short ton in FY2025. Nutrien's controllable cost for ammonia leaves out gas, the largest cost.
Read next
Natural Gas and Nitrogen Fertiliser Costs
How the Haber-Bosch route links gas to ammonia, why gas dominates the cost of nitrogen, the gap between US and European gas costs, and the gas sensitivities CF and Nutrien file.
Nitrogen, Phosphate, Potash Explained
The three crop nutrients, how each is produced, why cost drivers differ by N/P/K, and how Nutrien, CF Industries, and Mosaic illustrate integrated versus specialised models.
Chemical Industry Cost Curves
Feedstock as the primary axis of the ethylene cost curve; oil-vs-gas shifts; naphtha co-products; marginal producers idle first in downturns.
Fertiliser Price Benchmarks: FOB vs CFR
What FOB, CFR and CIF mean for a fertiliser price, how producers report the prices they realise, and why a price and a cost give a true margin only on the same delivery basis.
Fertiliser EBITDA per Tonne by Nutrient
FY2025 EBITDA per tonne sold for each nutrient business at Nutrien, CF Industries, Mosaic and ICL, why the tonne and the price basis belong on every figure, and how to rebuild it from price and cost.
See it applied
These company profiles apply the concepts from this guide to real public companies.