Agribusiness · Fertilisers
Fertiliser EBITDA per Tonne by Nutrient
FY2025 EBITDA per tonne sold ran from $128 at ICL's potash to $197 at Nutrien's nitrogen. How to work it out, and why the tonne and price basis matter.
Selborne Research · Fertilisers coverage: 7 guides, 6 company profiles, a primer and Excel model
Educational analysis for professional use. This guide is not investment advice or a recommendation to buy or sell any security, and it is not personalised.
On this page
EBITDA per Tonne Is Price Less the Cost of Each Tonne
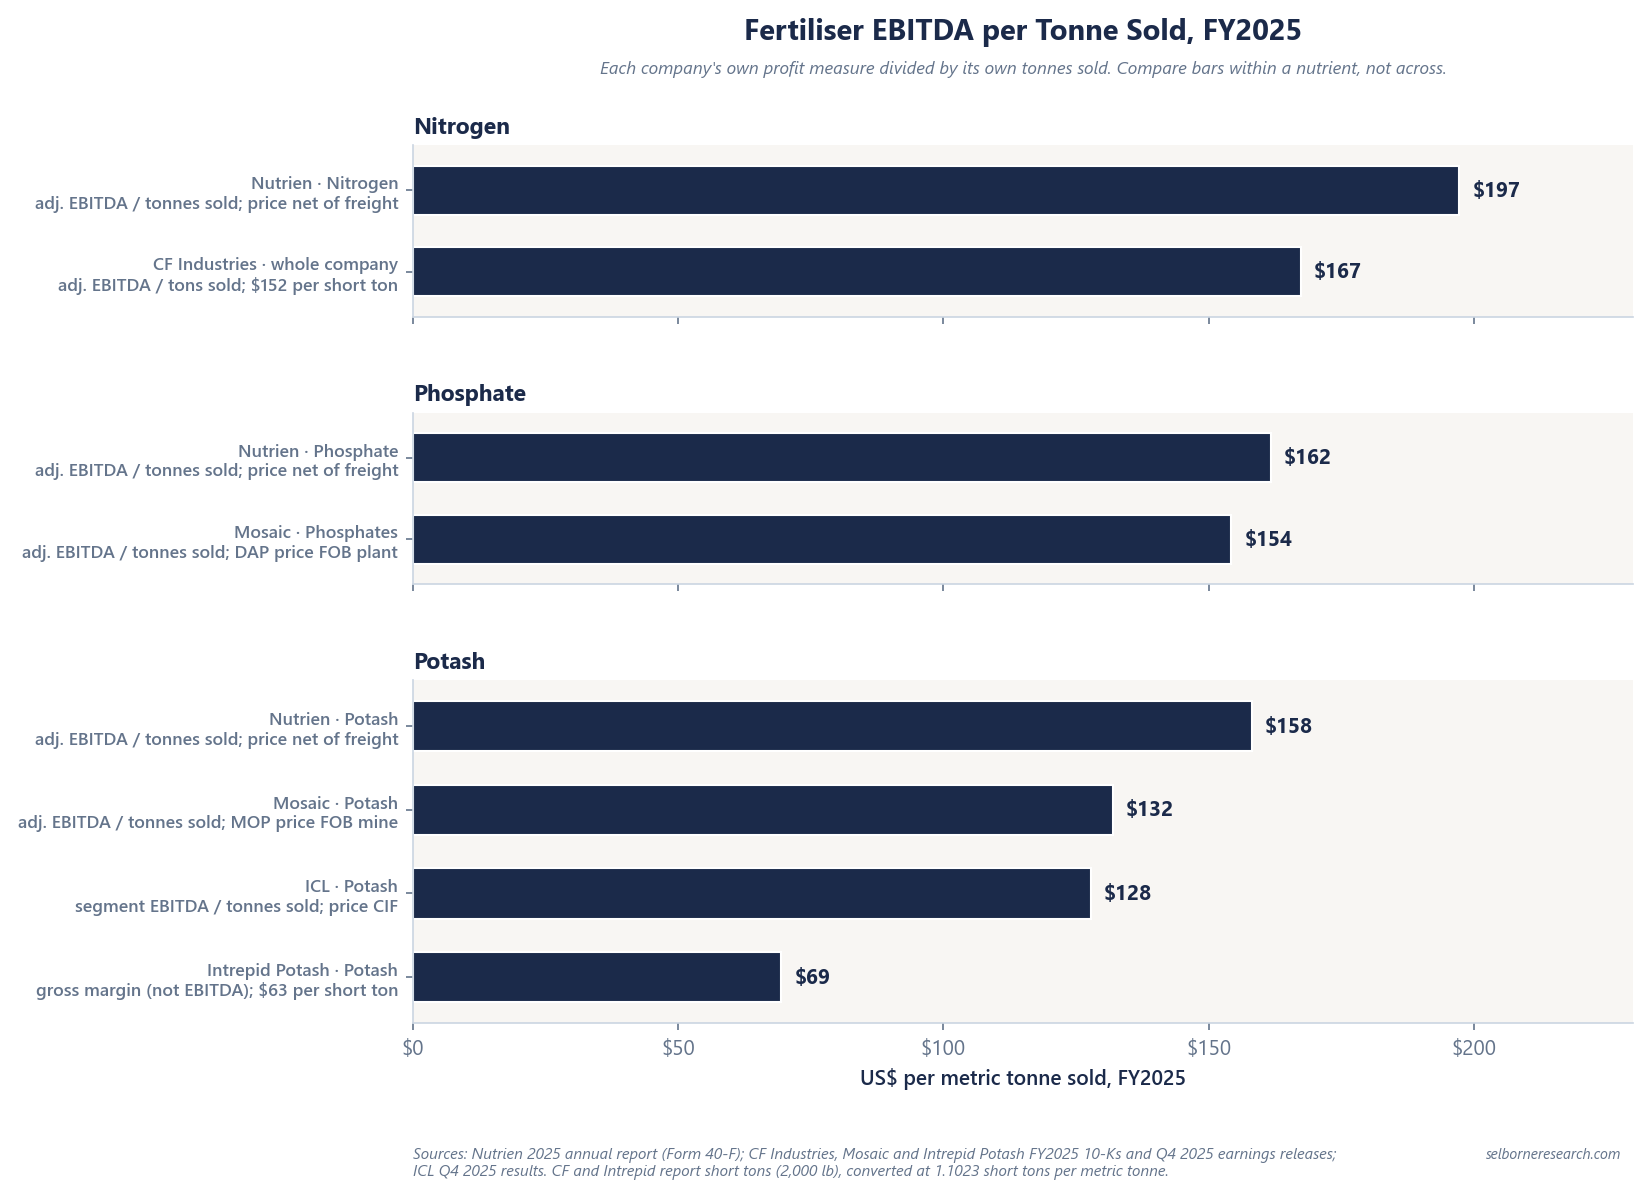
A fertiliser producer’s EBITDA per tonne is the price it realised on a tonne less what that tonne cost to mine or make and deliver, so in any one year it mostly records where nutrient prices stood. In FY2025, seven nutrient businesses at four producers earned between $128 and $197 of EBITDA a tonne sold; Intrepid Potash, which files gross margin rather than EBITDA, earned $69. Within each nutrient, the order also depends on which tonnes a company counts, where its price is measured and what its segment line holds.
EBITDA per tonne, as used here, is a segment’s EBITDA divided by the tonnes that segment sold in the same year. Of the companies here, only CF Industries files it as a ratio. Divide by tonnes sold, not produced: EBITDA is earned when product is sold, and a year’s output can go into stock or come out of it. Nutrien produced 13.97 million tonnes of potash in 2025, fewer than it sold.
Three labels belong beside every figure. The profit measure, because adjusted EBITDA, segment EBITDA and gross margin are different lines. The tonne, because US producers report in short tons: a metric tonne is 2,204.6 lb and a short ton 2,000 lb, so a figure per short ton times 1.1023 gives the figure per tonne. And the price basis, which says where the realised price is measured: at the mine or plant (FOB, free on board), net of freight, or delivered to the buyer’s port with freight and insurance paid (CIF).
FY2025 EBITDA per Tonne Sold, by Nutrient
| Nutrient | Company and segment | FY2025 profit, company’s measure | Tonnes sold, millions | $ per tonne | Price basis |
|---|---|---|---|---|---|
| Nitrogen | Nutrien, Nitrogen | $2,147M adjusted EBITDA | 10.89 | 197 | Net of freight |
| Nitrogen | CF Industries, whole company | $2,893M adjusted EBITDA | 17.29 (19.06 million short tons) | 167 ($152 per short ton) | Freight counted in costs |
| Phosphate | Nutrien, Phosphate | $382M adjusted EBITDA | 2.36 | 162 | Net of freight |
| Phosphate | Mosaic, Phosphates | $917M adjusted EBITDA | 5.95 (finished product) | 154 | DAP price FOB plant |
| Potash | Nutrien, Potash | $2,254M adjusted EBITDA | 14.25 | 158 | Net of freight |
| Potash | Mosaic, Potash | $1,183M adjusted EBITDA | 8.97 | 132 | MOP price FOB mine |
| Potash | ICL, Potash | $552M segment EBITDA | 4.32 | 128 | CIF |
| Potash | Intrepid Potash, Potash | $18.2M segment gross margin | 0.26 (0.289 million short tons) | 69 ($63 per short ton) | Net of freight |
Years to 31 December 2025. Sources: Nutrien’s 2025 annual report (filed on Form 40-F); the FY2025 10-Ks and fourth-quarter releases of CF Industries, Mosaic and Intrepid Potash; ICL’s fourth-quarter 2025 results.
Each row holds something slightly different. Nutrien counts only product it made, and its Nitrogen EBITDA includes its share of earnings from Profertil, an Argentine producer it half-owned until it sold the stake in 2025. Mosaic’s tonnes are finished product only, while its $917M also includes the profit on 1.76 million tonnes of phosphate rock it sold, so its figure per tonne reads high. ICL’s tonnes include sales to its own other divisions, and its Potash segment also sells salt, magnesium, chlorine and surplus electricity, almost a fifth of the segment’s sales.
CF Industries makes only nitrogen, so its whole-company figure is a nitrogen figure. It is measured after corporate costs, which Nutrien’s segment figures leave out. It is also struck after the minority owners’ share of earnings, $343M of FY2025 net earnings (CHS, a US farm cooperative, owns about 11% of CF’s main US subsidiary), while the tonnes count every ton sold.
Intrepid Potash’s row is segment gross margin, the profit line its segment note uses. Gross margin comes after depreciation, so it reads lower than EBITDA would for the same business, and it includes sales of by-products such as salt, magnesium chloride and brines. Yara International, a large nitrogen producer listed in Oslo, reports its segments by region, so no nutrient row can be built from it.
Read It Within a Nutrient, Never Across
A similar figure in two nutrients hides very different businesses, because a tonne of each sells for a very different price. Nutrien’s phosphate and potash earned almost the same EBITDA a tonne, but its phosphate sold for $725 a tonne net of freight and its potash for $252. EBITDA was 22% of the phosphate price and 63% of the potash price. A tonne of phosphate fertiliser carries the cost of the rock, sulphur and ammonia that go into it; a tonne of potash is mined and refined ore.
Nitrogen adds a second trap. Its tonnes are tonnes of product, and nitrogen products carry different amounts of nitrogen: ammonia is 82% nitrogen, urea 46%, and UAN (a urea and ammonium nitrate solution) and AN (ammonium nitrate) roughly 30%. CF Industries reports its margin per ton both ways, and the ranking of its products changes. Its measure is adjusted gross margin: gross margin before depreciation, before unrealised gains and losses on gas hedges, and before selling and administrative costs.
| CF product, FY2025 | Nitrogen content | Adjusted gross margin, $ per short ton of product | $ per short ton of nitrogen |
|---|---|---|---|
| Granular urea | 46% | 266 | 577 |
| Ammonia | 82% | 203 | 247 |
| UAN | 28-32% | 171 | 540 |
| AN | 29-35% | 84 | 245 |
Per ton of product, ammonia earns more than UAN. Per ton of nitrogen, UAN earns more than twice as much. Nutrien’s nitrogen tonnes are also product tonnes, 49% of them solutions, nitrates and sulphates, so a nitrogen producer’s figure per tonne reflects its product mix as well as its margins.
Rebuilding It from Price and Cost
EBITDA per tonne can be rebuilt from a realised price and the unit costs a company files, which the cost curve guide sets out producer by producer, as long as price and cost are measured at the same place. Where the price is measured barely changes EBITDA itself: freight billed to the customer is revenue, and the freight the producer pays is a cost. It matters when you start from a price, because an FOB mine price already has the freight taken off and a CIF price does not.
Mosaic files enough on its potash business to try it:
| Mosaic Potash, FY2025 | $ per tonne |
|---|---|
| MOP realised price, FOB mine | 255 |
| less cash cost of production | 75 |
| less royalties and Canadian resource taxes | 35 |
| Price less the filed unit costs | 145 |
| Filed EBITDA per tonne sold | 132 |
The $13 gap is costs that neither unit figure covers. Mosaic’s cash cost is per tonne produced and leaves out brine costs, and the segment also carried $59M of idle and turnaround costs, about $7 a tonne sold, and $30M of selling and administrative costs, about $3. The same $75 and $35 set against a price landed in Brazil would count the sea freight as margin; the FOB vs CFR guide works that through for a fictional potash miner.
Intrepid Potash’s per-ton figures show the same trap, with by-products in place of freight. Its realised potash price, $353 a short ton, leaves out by-product sales, while its cost of goods sold, $328 a short ton, spreads the whole segment’s costs over its potash tons alone. One less the other gives $25, well below the segment’s own gross margin in the table.
One Company, Two Years
A year’s EBITDA per tonne records that year’s prices. CF Industries sold 0.6% more tons in FY2025 than in FY2024. Its average selling price rose from $313 to $372 a short ton, and the cost of the gas it used from $2.40 to $3.31 per MMBtu (million British thermal units). Adjusted EBITDA per short ton went from $120.57 to $151.81. With volume that steady, the change came from the price, net of dearer gas, which is why each year’s figure should carry its year wherever it is quoted.
What EBITDA per Tonne Leaves Out
It says nothing about the capital behind each tonne. EBITDA comes before depreciation, so a potash mine, a phosphate complex with its own rock and a gas-fed nitrogen plant can earn the same figure while needing very different spending to keep producing. Nor does it cover a whole company: Nutrien’s farm retail business and Mosaic Fertilizantes, Mosaic’s Brazilian production and distribution arm, sit outside the nutrient rows. The N/P/K guide sets out which producer makes which nutrient.
EBITDA per tonne is price less cost. The primer builds four fictional producers' margins from gas, rock, sulphur and mining costs, then values each over ten years.
- 15 sections, from how a nutrient producer earns to a year-by-year DCF and leverage on mid-cycle EBITDA
- 43 pages
- a US nitrogen producer on Henry Hub gas, a European nitrogen producer, a phosphate producer and a potash miner
- 4 producer engines
- listed nitrogen, phosphate and potash producers on filed FY2025 figures
- 6-company screen
The Excel model is the primer's mid-cycle valuation live across 13 sheets: four producer tabs (US nitrogen on Henry Hub gas, European nitrogen, phosphate and potash), each walking nutrient prices from the starting point back to mid-cycle through a ten-year free-cash-flow schedule with working capital and sustaining capex; a valuation summary setting each DCF beside the multiple cross-check and splitting the gap between them; cycle scenarios, a cost curve with a gas cost curve, a leverage screen on mid-cycle EBITDA and two live sensitivity grids, urea price against the exit multiple and against the gas price. Change the nutrient price, the gas price or the WACC and the value moves.
See what's in the Fertilisers Sector Primer →£25 PDF · £59 with the Excel model · £159 for all three Agribusiness industries
Frequently Asked Questions
- How do you calculate EBITDA per tonne for a fertiliser producer?
- Divide a nutrient segment's EBITDA by the tonnes that segment sold in the same year. Nutrien's Potash segment earned $2,254M of adjusted EBITDA in FY2025 on 14.25 million tonnes sold, or $158 a tonne. Put the profit measure, the tonne (metric or short) and the price basis beside every figure, and compare figures within one nutrient only.
- What was CF Industries' EBITDA per ton in FY2025?
- $151.81 per short ton of product, on adjusted EBITDA of $2,893M and 19.06 million short tons sold. CF files the ratio itself. A short ton is 2,000 lb, so the figure is about $167 per metric tonne. It was $120.57 per short ton in FY2024 on almost the same volume, and the rise came mainly from higher selling prices.
- Why can't you compare EBITDA per tonne across nitrogen, phosphate and potash?
- Because a tonne of each nutrient sells for a very different price and carries different costs. In FY2025 Nutrien earned about the same EBITDA per tonne in phosphate and potash, but that was 22% of its phosphate price and 63% of its potash price. Nitrogen adds a second problem: the tonnes are tonnes of product, and nitrogen products range from 28% to 82% nitrogen.
Read next
Fertiliser Cost Curves Explained
How nitrogen, phosphate, and potash cost curves are set by gas access, rock integration, and ore grade, with FY2025 disclosed unit costs from Nutrien, Mosaic, and Intrepid Potash.
Nitrogen, Phosphate, Potash Explained
The three crop nutrients, how each is produced, why cost drivers differ by N/P/K, and how Nutrien, CF Industries, and Mosaic illustrate integrated versus specialised models.
Fertiliser Price Benchmarks: FOB vs CFR
What FOB, CFR and CIF mean for a fertiliser price, how producers report the prices they realise, and why a price and a cost give a true margin only on the same delivery basis.
See it applied
These company profiles apply the concepts from this guide to real public companies.