Agribusiness · Fertilisers
Fertiliser Price Benchmarks: FOB vs CFR
A fertiliser price names a place and a delivery term. How FOB, CFR and CIF differ, how producers report realised prices, and how to match price and cost.
Selborne Research · Fertilisers coverage: 7 guides, 6 company profiles, a primer and Excel model
Educational analysis for professional use. This guide is not investment advice or a recommendation to buy or sell any security, and it is not personalised.
On this page
A Fertiliser Price Names a Place
Two prices for the same fertiliser in the same year can sit more than $90 a tonne apart without anyone earning more. Mosaic realised $255 a tonne for potash at its mines in FY2025. Granular potash landed in Brazil averaged $347.5 a tonne over 2025 on the World Bank’s price series. Most of the difference is the cost of moving a tonne to a Brazilian port, and none of it is extra margin.
So every fertiliser price carries two labels: the place it is quoted at and the delivery term, which says how much of the journey the price has already paid for. A price and a cost compare only when they carry the same two labels. Mix them and freight either turns into profit or gets deducted twice.
FOB, CFR and CIF
The three terms come from Incoterms 2020, the International Chamber of Commerce’s rules for who pays for each leg of a shipment and when the risk of loss passes from seller to buyer. All three are written for sea and inland waterway transport.
| Term | Seller pays up to | Risk passes to the buyer | Seller insures the cargo |
|---|---|---|---|
| FOB, free on board | Loading on the buyer’s vessel at the port of shipment | Once the goods are on board at the port of shipment | No |
| CFR, cost and freight | The port of destination | Once the goods are on board at the port of shipment | No |
| CIF, cost, insurance and freight | The port of destination, plus insurance | Once the goods are on board at the port of shipment | Yes, at least limited cover under the standard Institute Cargo Clauses (C) |
Risk passes at the same moment under all three, when the cargo is loaded. What changes is who has paid for the voyage. A CFR price is an FOB price plus sea freight, and a CIF price adds insurance on top.
Producers use the labels more loosely. “FOB mine” and “FOB plant” mean the price at the mine or plant gate, before any rail, barge or sea freight; under Incoterms, FOB means loaded on a ship at a port. ICL spells out its own usage in its annual report: FOB expenses cover overland transport, loading and other costs up to and including the port of origin, and a CIF price also covers insurance, shipping and any other costs up to the destination port.
One Potash Miner, Measured at Two Places
Take a fictional potash miner. Its cash cost at the mine is $75 a tonne, royalties and resource taxes add $35, and freight and port handling to Brazil add $90. Delivered to a Brazilian port, a tonne costs $200. Suppose potash sells for $300 a tonne CFR Brazil, a price picked to keep the arithmetic round. Take off the $90 of freight and the same sale is worth $210 a tonne at the mine.
| $ per tonne | Measured in Brazil (CFR) | Measured at the mine (FOB mine) |
|---|---|---|
| Price | 300 | 210 |
| Mine cash cost | 75 | 75 |
| Royalties and resource taxes | 35 | 35 |
| Freight and handling to Brazil | 90 | none: already out of the price |
| Margin | 100 | 100 |
The margin is $100 either way, because the freight sits on both sides of the sum in Brazil and on neither side at the mine. Mixing the bases breaks it. The CFR price less the mine-gate cost gives $190, which counts the freight as profit. The FOB price less the delivered cost gives $10, which takes the freight off twice.
Nutrien’s 2024 Investor Day drew its potash cost curve the same way, as a delivered cash cost to Brazil, the market the World Bank’s potash price is quoted for. The cost curve guide sets filed unit costs side by side and says which of them already include royalties.
Each Benchmark Has Its Own Place and Term
The reference price for each nutrient is quoted somewhere different, on a different term, so the benchmarks do not line up with one another either. The World Bank’s monthly commodity price data, known as the Pink Sheet, defines each of its three fertiliser series by product, delivery term and place, all in dollars per metric tonne.
| Benchmark | Term and place | Unit | Source |
|---|---|---|---|
| Urea, prilled, spot | FOB Middle East | $ per tonne | World Bank Pink Sheet |
| Potash (muriate of potash, MOP), granular, spot | CFR Brazil | $ per tonne | World Bank Pink Sheet |
| DAP (diammonium phosphate), spot | FOB US Gulf | $ per tonne | World Bank Pink Sheet |
| Ammonia | CFR Tampa, Florida | $ per tonne | Not a Pink Sheet series; used in a Mosaic supply contract (2014 10-K) and Nutrien’s 2024 price scenario |
Two of the four are export prices and two are import prices. The World Bank labels its urea series “Urea, E. Europe”, but its description gives prilled urea FOB Middle East, and the description is what sets the basis. A second source gives almost the same figure for the same market: ICL’s annual report quotes CRU, a price reporting agency, for granular potash CFR Brazil at $348 a tonne in 2025, against the World Bank’s $347.5.
What Producers Report
None of these producers reports a CFR Brazil price. Each reports an average of what it received across the year, on its own basis.
| Company and product | FY2025 average price | Where the price is measured | Unit |
|---|---|---|---|
| Mosaic, MOP | $255 | At the mine (FOB mine) | Metric tonne |
| Mosaic, DAP | $670 | At the plant (FOB plant) | Metric tonne |
| ICL, potash | $333 | At the destination port (CIF) | Metric tonne |
| Nutrien, potash | $252 | Net of freight, transportation and distribution | Metric tonne |
| Intrepid Potash, potash | $353 ($389 a tonne) | Net of freight | Short ton |
Only ICL’s figure includes the sea voyage, and it averages every destination port ICL shipped to, not Brazil alone. The other four exclude freight, so they sit close to a price at the mine, but each nets it off its own mix of customers and routes.
Nutrien divides net sales, which it defines as sales less freight, transportation and distribution, by tonnes sold; its $252 splits into $286 in North America and $235 offshore. Intrepid takes by-product sales and freight out of its potash segment’s sales before dividing by short tons sold; the freight came to about $45 a short ton in FY2025. Mosaic’s earnings release labels its DAP price “FOB plant”, while its 10-K labels the same $670 “fob mine”. Both describe a price before freight.
From the Mine to Brazil, 2025
Set Mosaic’s price at the mine beside the World Bank’s price in Brazil and the two bridge in a single step.
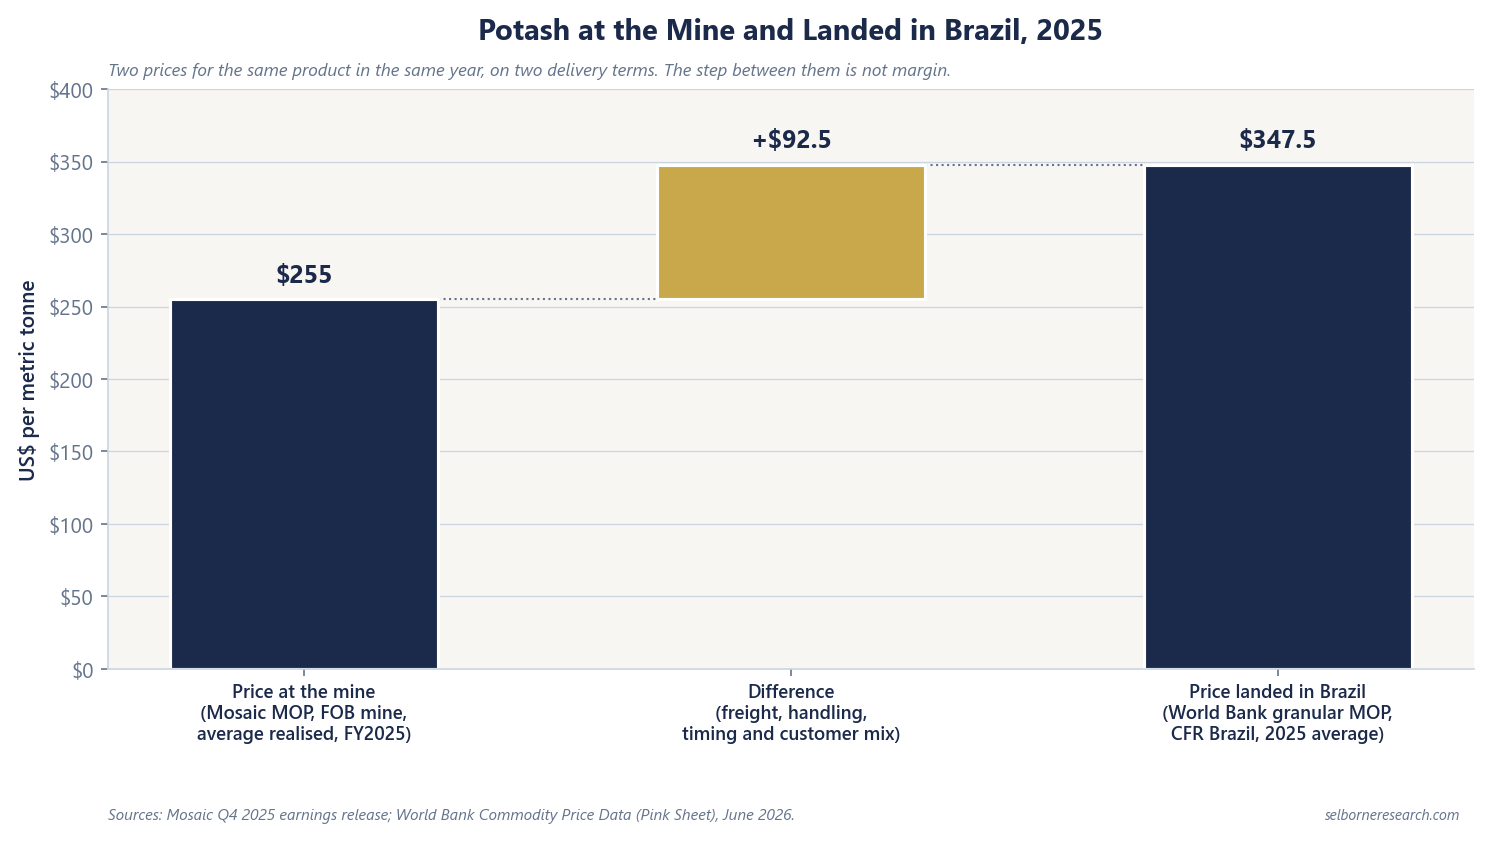
$347.5 less $255 is $92.5 a tonne. For the fourth quarter of 2025 alone the gap was $90.7: $354.7 in Brazil against $264 at the mine. Not all of it is freight. Mosaic’s figure averages every tonne it sold in the year, wherever it went and under whatever contract. The World Bank’s figure averages spot prices for granular potash arriving in Brazil. Contract timing and customer mix sit inside the gap alongside freight and handling, so read it as a rough guide to freight.
Short Tons and Metric Tonnes
Some prices differ in unit as well as term. A short ton is 2,000 lb, or 0.907 metric tonnes, and US filers such as Intrepid and CF Industries report in short tons. Intrepid’s $353 a short ton is $389 a tonne. Nutrien’s 2024 Investor Day price scenario quoted urea and DAP at NOLA, the New Orleans market, “per ton”, and potash and Tampa ammonia per tonne. The same price looks about 9% lower per short ton than per tonne, so convert before comparing: a price per short ton times 1.1023 is the price per tonne.
What a Matched Basis Does Not Fix
Putting a price and a cost at the same place removes the freight error and nothing else. Three differences survive it.
- Timing. A realised price averages the contracts delivered across the year; a benchmark averages spot prices. When prices move fast the two part company, which the price cycle guide traces through the lag from grain prices to nutrient prices to producer earnings.
- Product. The potash benchmark is granular grade, while a producer’s average covers every grade it sells.
- Market. The benchmark’s place need not be where a producer sells. A mine that ships nothing to Brazil never pays the freight to Brazil; its price at the mine is what buyers pay where it does sell, less the freight to get there.
A margin needs one basis. The primer costs a potash miner delivered to Brazil, where its price is quoted, then values four illustrative producers over ten years.
- 15 sections, from how a nutrient producer earns to a year-by-year DCF and leverage on mid-cycle EBITDA
- 43 pages
- a US nitrogen producer on Henry Hub gas, a European nitrogen producer, a phosphate producer and a potash miner
- 4 producer engines
- listed nitrogen, phosphate and potash producers on filed FY2025 figures
- 6-company screen
The Excel model is the primer's mid-cycle valuation live across 13 sheets: four producer tabs (US nitrogen on Henry Hub gas, European nitrogen, phosphate and potash), each walking nutrient prices from the starting point back to mid-cycle through a ten-year free-cash-flow schedule with working capital and sustaining capex; a valuation summary setting each DCF beside the multiple cross-check and splitting the gap between them; cycle scenarios, a cost curve with a gas cost curve, a leverage screen on mid-cycle EBITDA and two live sensitivity grids, urea price against the exit multiple and against the gas price. Change the nutrient price, the gas price or the WACC and the value moves.
See what's in the Fertilisers Sector Primer →£25 PDF · £59 with the Excel model · £159 for all three Agribusiness industries
Frequently Asked Questions
- What is the difference between FOB and CFR fertiliser prices?
- An FOB (free on board) price values the cargo once it is loaded at the port of shipment. A CFR (cost and freight) price adds the sea freight to the destination port, which the seller pays. Under Incoterms 2020 the risk passes to the buyer at loading under both terms, so the gap between the two prices is freight, not a difference in who carries the cargo. The World Bank quotes potash CFR Brazil, and urea and DAP FOB at the export port.
- Why is Mosaic's potash price lower than the CFR Brazil benchmark?
- The two are measured at different places. Mosaic reports its potash (MOP) price at the mine, $255 a tonne in FY2025, before any freight. The World Bank's granular potash price is CFR Brazil, landed at a Brazilian port, and averaged $347.5 a tonne in 2025. The $92.5 between them is freight, handling, contract timing and customer mix. It is not margin.
- Does Nutrien's potash net selling price include freight?
- No. Nutrien reports net sales, which it defines as sales less freight, transportation and distribution expenses, and divides them by tonnes sold. Its FY2025 potash average net selling price was $252 a tonne: $286 in North America and $235 offshore.
- What does CIF mean in ICL's potash price?
- Cost, insurance and freight. In ICL's own definition a CIF price covers the costs of getting the goods to the port of origin plus insurance, shipping and any other costs up to the destination port. ICL's annual report on Form 20-F gives an FY2025 potash price of $333 a tonne CIF, an average across every destination it shipped to.
Read next
Fertiliser Cost Curves Explained
How nitrogen, phosphate, and potash cost curves are set by gas access, rock integration, and ore grade, with FY2025 disclosed unit costs from Nutrien, Mosaic, and Intrepid Potash.
Reading the Crop-Nutrient Cycle
How corn and soy margins drive fertiliser application, what the 2026 Hormuz supply shock did to urea, and the lags between grain economics, nutrient prices and producer earnings.
Fertiliser EBITDA per Tonne by Nutrient
FY2025 EBITDA per tonne sold for each nutrient business at Nutrien, CF Industries, Mosaic and ICL, why the tonne and the price basis belong on every figure, and how to rebuild it from price and cost.
See it applied
These company profiles apply the concepts from this guide to real public companies.